Usage
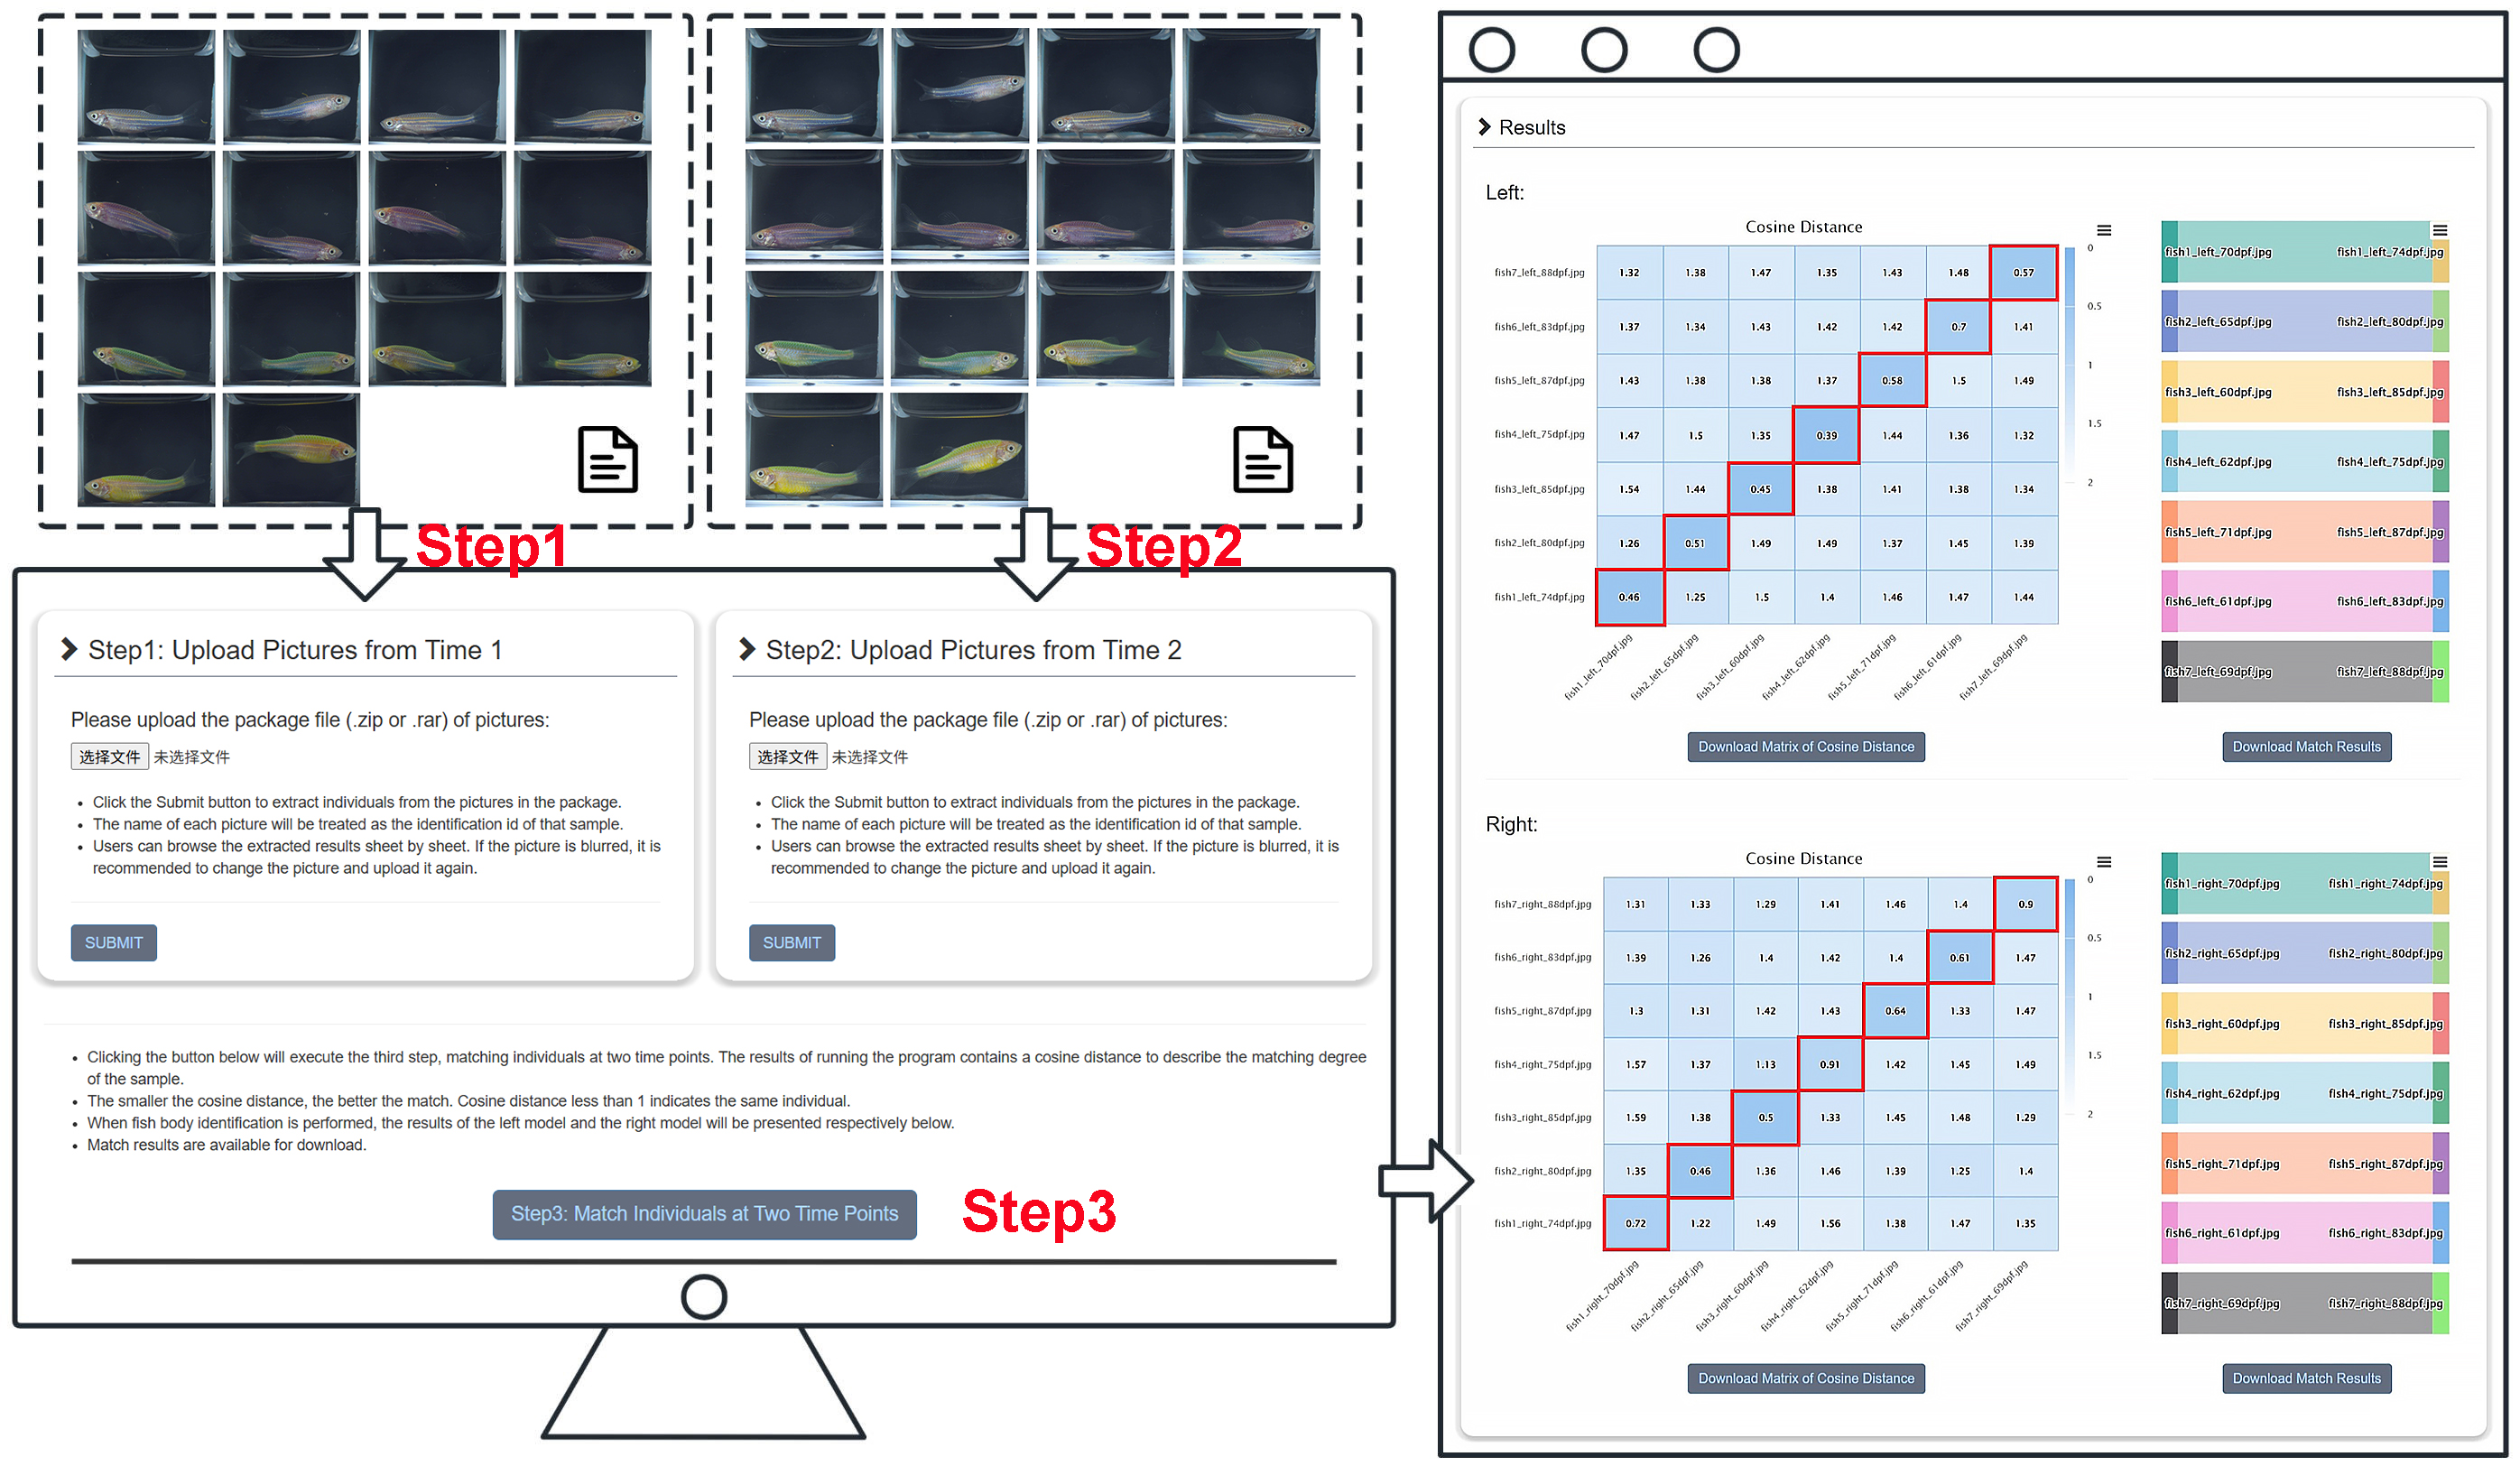
- The main steps involved in individual identification on an online platform and the output results. As illustrated in the figure, the operational process of the platform is composed of 3 fundamental steps.
- Initially, lateral-view images captured at Time Point 1 are uploaded. Then, the corresponding images captured at Time Point 2 are uploaded.
- Subsequently, a matching request is submitted, and the platform returns the identification results, which include a cosine distance matrix (visualized as a heatmap) representing pairwise similarities between individuals across the two time points, and the corresponding matching results inferred from the cosine distances, presented as a Sankey diagram.
Data Download —— Some test data
Some examples of zebrafish images:
Dataset Distribution of ESC-IDNet
- Data distribution for training and testing the ESC-IDNet framework during 31-122 dpf and corresponding evaluation results.
The lateral body and dorsal head are designated as "body" and "back" in Figure, respectively.
-
A.(left) Training, validation, and test sets for ESCAlignNet training on zebrafish lateral body (body) and dorsal head (back) instance segmentation and keypoint recognition.
15,642 lateral body images and 8,047 dorsal head images, respectively.
-
B.(bottom left) IDNet module training/validation datasets (line graph/bar chart), with daily sampling in Stage 1 (31-40 dpf) and alternate-day sampling in Stage 2 (60-70 dpf).
The data were exclusively sourced from the longitudinally imaged Group A dataset, comprising 150 zebrafish.
-
C.(bottom right) Test set data for IDNet models during Stage 1 and Stage 2: number of test images categorized by imaging view (left lateral, right lateral, dorsal).
-
Test Set 1 employed the generated LFW-formatted files to assess both stage-specific models.
-
Test Set 2 administered chronological individual identification tests utilizing the Group A images. Both models were evaluated at every imaging timepoint between 31-122 dpf, with approximately ten images per individual per timepoint.
-
Test Set 3 evaluated both models using Group B data, comprising 300 zebrafish, with approximately ten randomly selected images per fish.
Model Construction
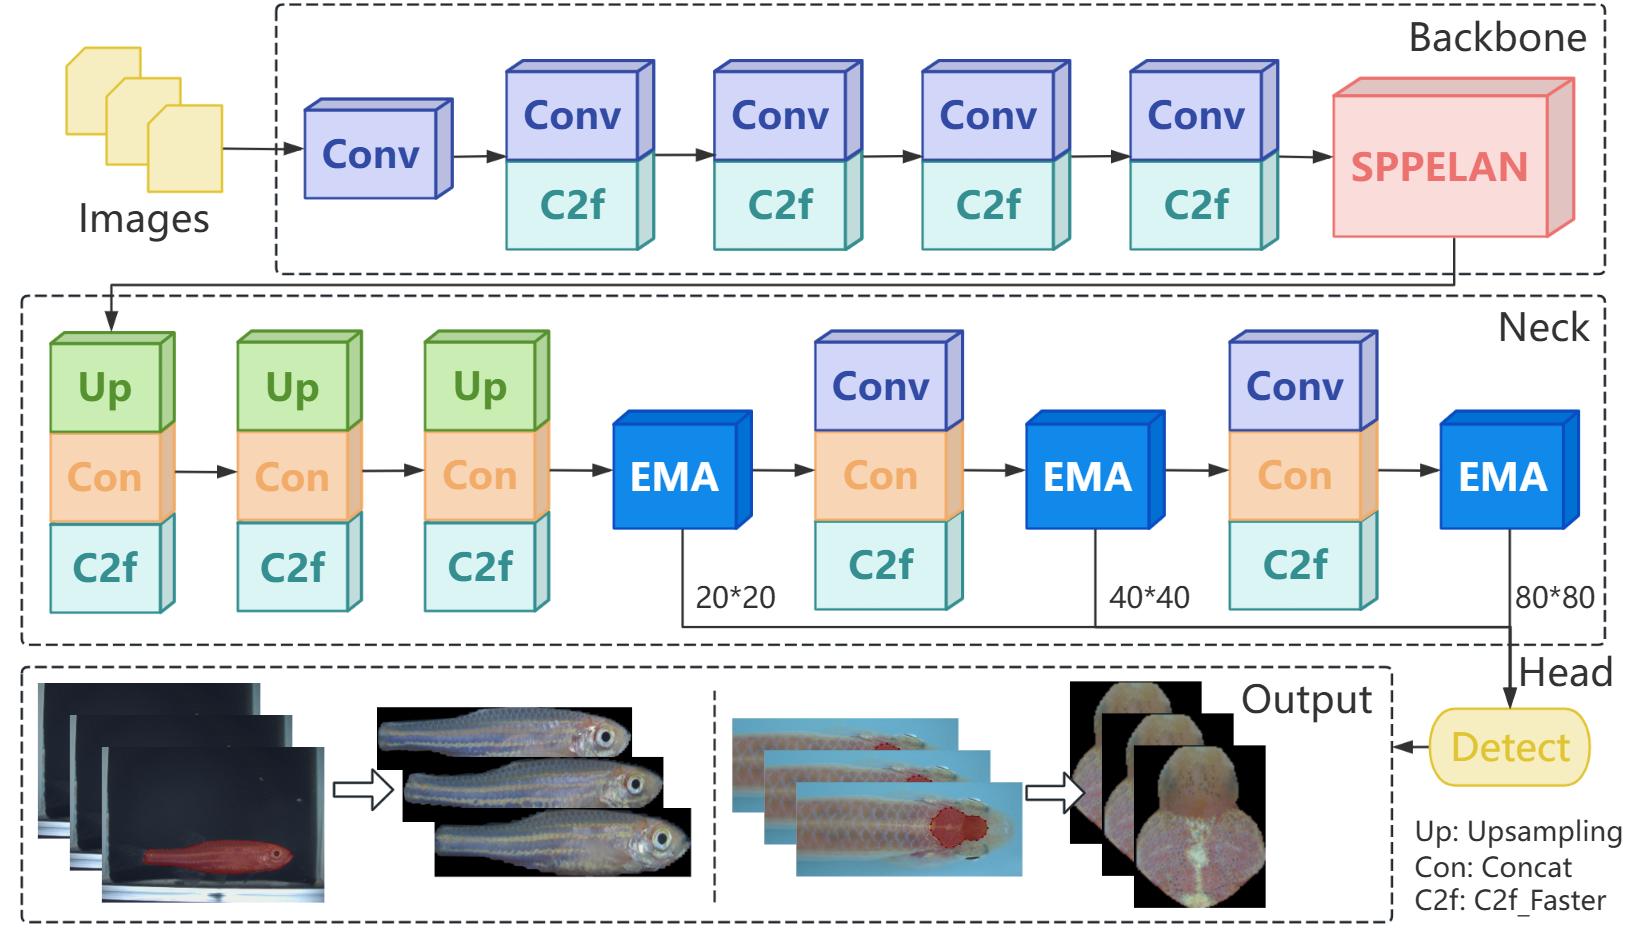
- Network structure of ESCAlignNet.
-
The zebrafish images undergo a series of processing steps, beginning with a thorough extraction of features by the backbone network.
Subsequently, the Neck undergoes a process of feature fusion and enhancement. In the final stage of the process, the multi-scale detection head performs precise detection and output of zebrafish.
In the context of the instance segmentation task, the output delineates the boundaries of the zebrafish lateral body and dorsal head regions with a high degree of precision, achieving precise separation from the background.
In the context of the keypoint detection task, the Output provides positional information regarding the lateral body and head skin, in addition to the coordinates of keypoints, including the fish eye, the midpoint of the caudal peduncle, and two dorsal points.
By leveraging these keypoints, the segmented images can be aligned to a standard posture, ensuring consistency for downstream feature extraction.
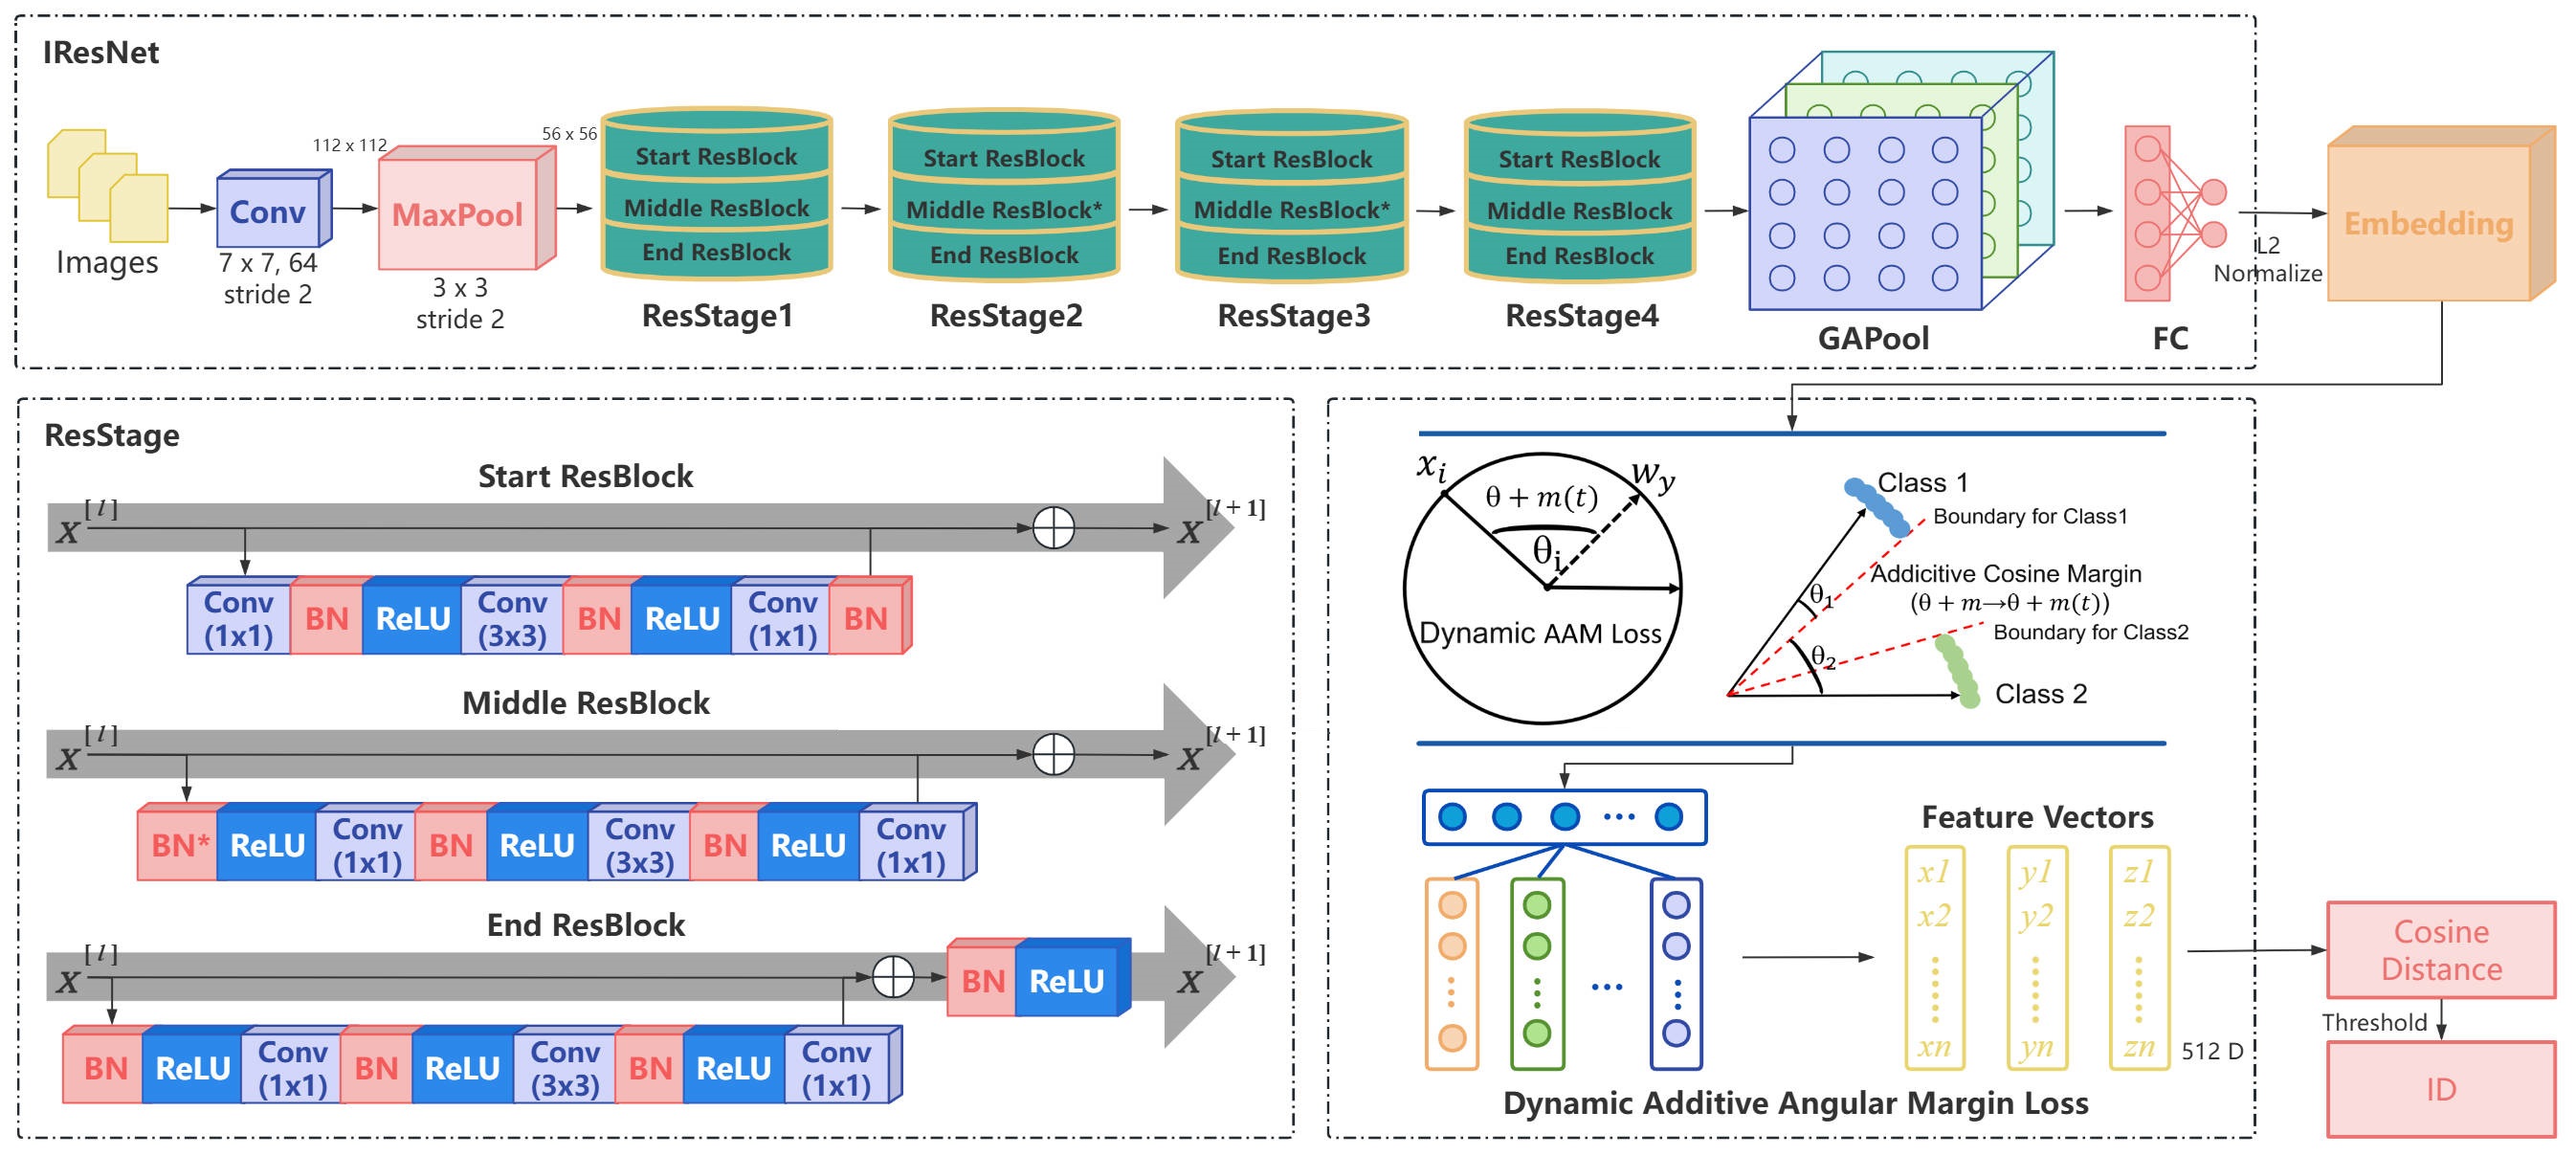
- Schematic diagram of the main network architecture of IDNet. A. Main architecture of IResNet. B. Main structure of ResStage.
C. Schematic diagram of dynamic additive angular margin loss optimization feature space.
- IDNet employs IResNet as the primary network for zebrafish image feature extraction and incorporates a modified ArcFace loss function (Additive Angular Margin Loss, AAM Loss).
The angular margin within ArcFace was adapted with the specific purpose of enhancing classification accuracy and model robustness for zebrafish individual identification.
- The input image, standardized by ESCAlignNet, is first processed by the IResNet backbone, generating a highly discriminative feature vector.
This vector undergoes L2 normalization, and the resulting embedding representation is then optimized via the Dynamic AAM Loss.
Evaluation Results of ESC-IDNet
- (left) Training and testing evaluation results for YOLOv8 versus ESCAlignNet.
The ESCAlignNet module was utilized to achieve 0.970 and 0.977 for precision in the test dataset for instance segmentation and keypoint recognition, respectively.
These values represent increases of 0.030 and 0.053 compared to the baseline YOLOv8 model.
- (right) Distribution comparison of SSIM values before and after standardization for images of three individuals across different regions.
Following the segmentation and alignment of 900 images (3 × 3 × 100) randomly selected from three individuals, the SSIM values for different regions per individual demonstrated significant increases (p < 0.01).
The mean SSIM for left lateral, right lateral, and dorsal head images increased from 0.5138, 0.5016, and 0.4075 to 0.5726, 0.5523, and 0.5576, respectively.
This finding suggests that standardization processing significantly enhances intra-class consistency within individual samples.
- Utilizing the LFW-formatted Test Set 1, a comparative evaluation was conducted on stage-specific IDNet models, with an analysis of performance across various combinations of backbone networks and loss functions
- (Upper left) Test Set 1 evaluation results for the Stage 1 IDNet (Body) model. (Upper right) Test Set 1 evaluation results for the Stage 1 IDNet (Back) model.
- (bottom left) Test Set 1 evaluation results for the Stage 2 IDNet (Body) model. (bottom right) Test Set 1 evaluation results for the Stage 2 IDNet (Back) model.

 FishIndivID: Zebrafish individual identification and tracking online platform