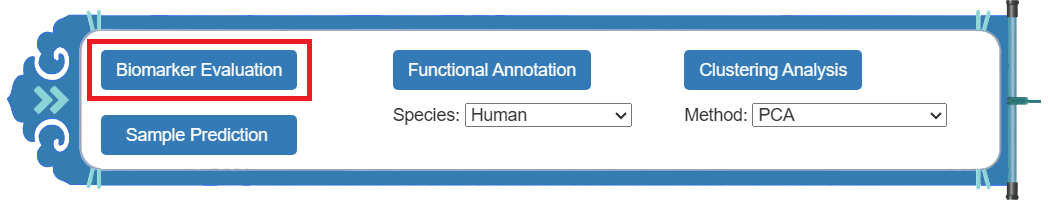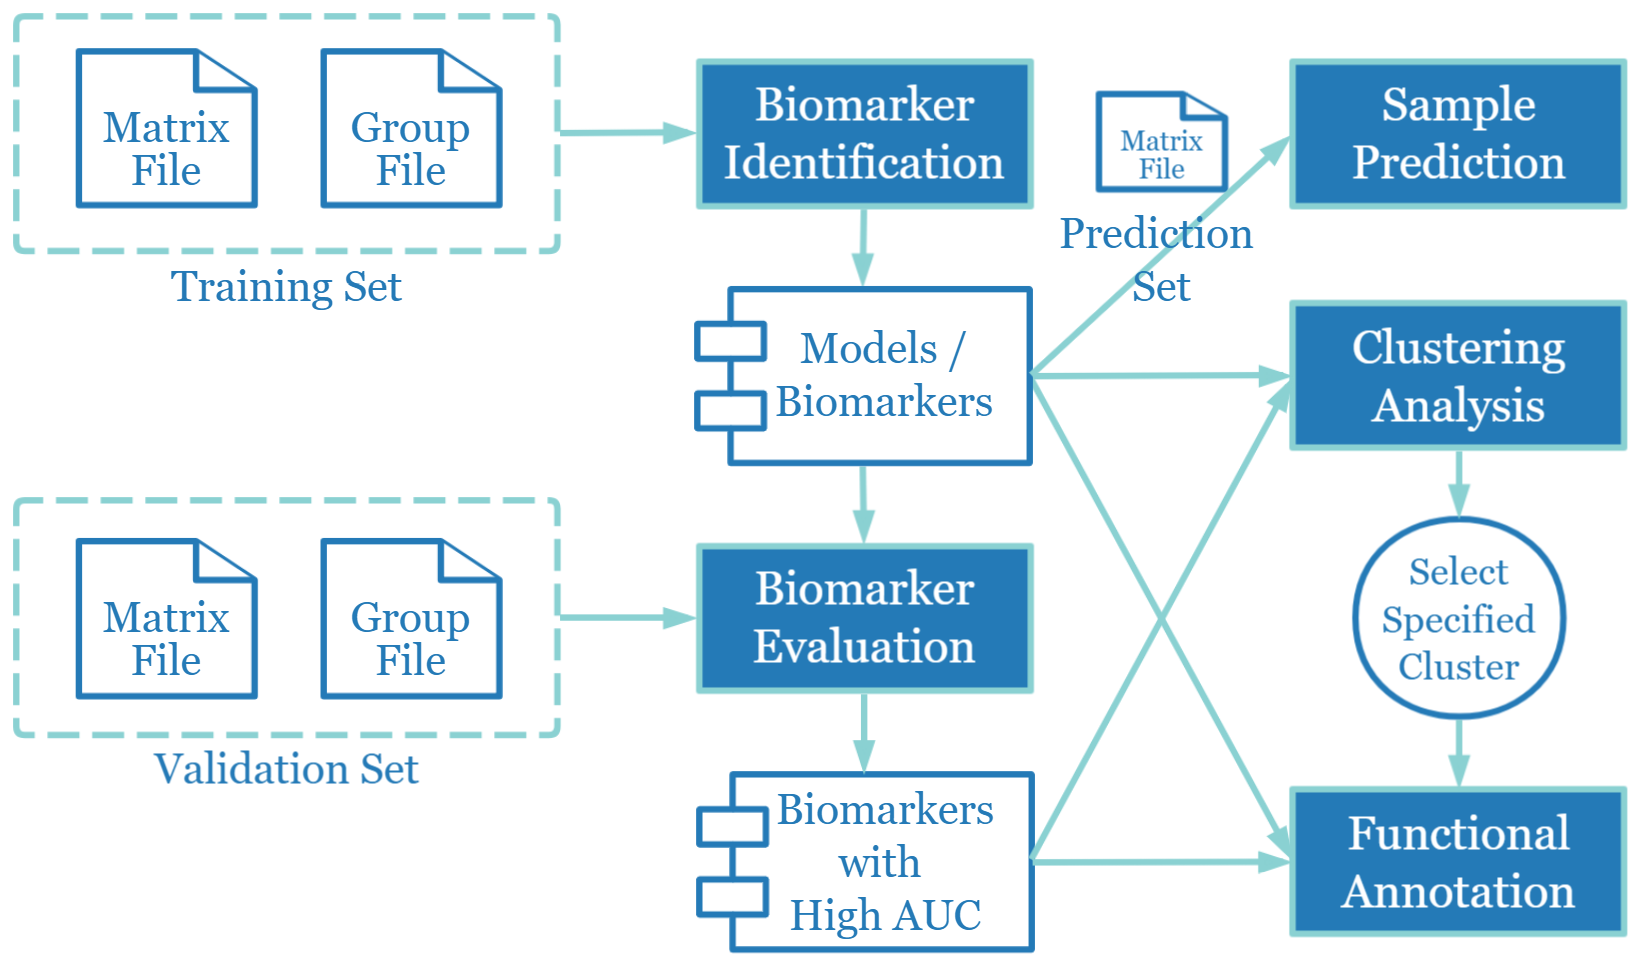
- The functional modules and analysis flow of MLBiomarker are shown in the left figure. The main analysis modules are "Biomarker Identification", "Biomarker Evaluation", "Sample Prediction", "Clustering Analysis" and "Functional Annotation". Among them, the first three parts require users to upload training / validation / prediction sets for analysis. In addition, MLBiomarker provides the ability to browse the Models / Biomarkers.
- The "Biomarker Identification" module is the core functional module of MLBiomarker, which is used for the construction of machine learning models and the screening of important features. The module implements 14 machine learning methods for binary/multi-class analysis, and 11 machine learning methods for survival analysis.
- After users perform an analysis of the "Biomarker Identification", a floating navigation bar will appear in the upper right corner of the results page for the analysis of the other four sections.
- The detailed usage of one-stop analysis will be expanded below.
Biomarker Identfication
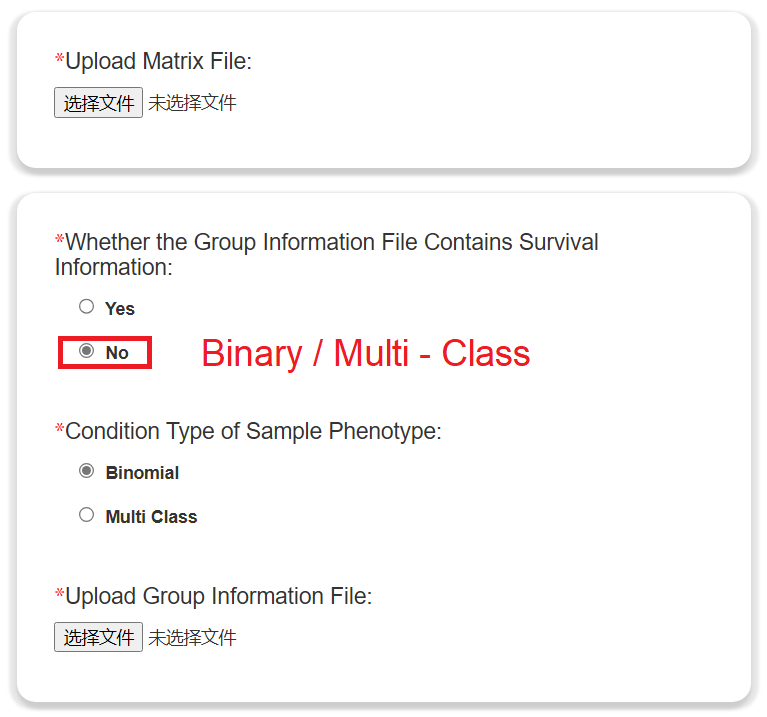
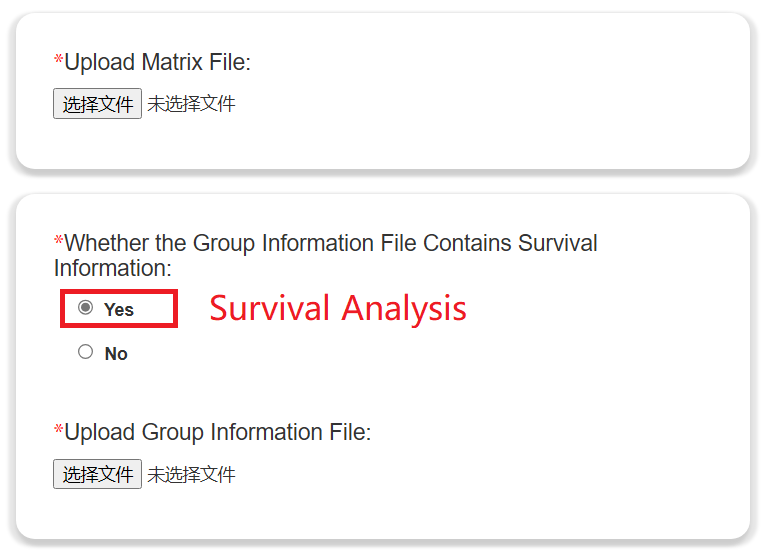
Step 1: Data Input
- The left side shows the form of data upload, and the right side lists the upload data of various analysis cases. Click the button in the table to download the case dataset.
- The format of the input data should be consistent with the case data, otherwise there will be no result.
- Click on the options of the form to perform the corresponding analysis type.
Step 2: Method and Parameter Selection
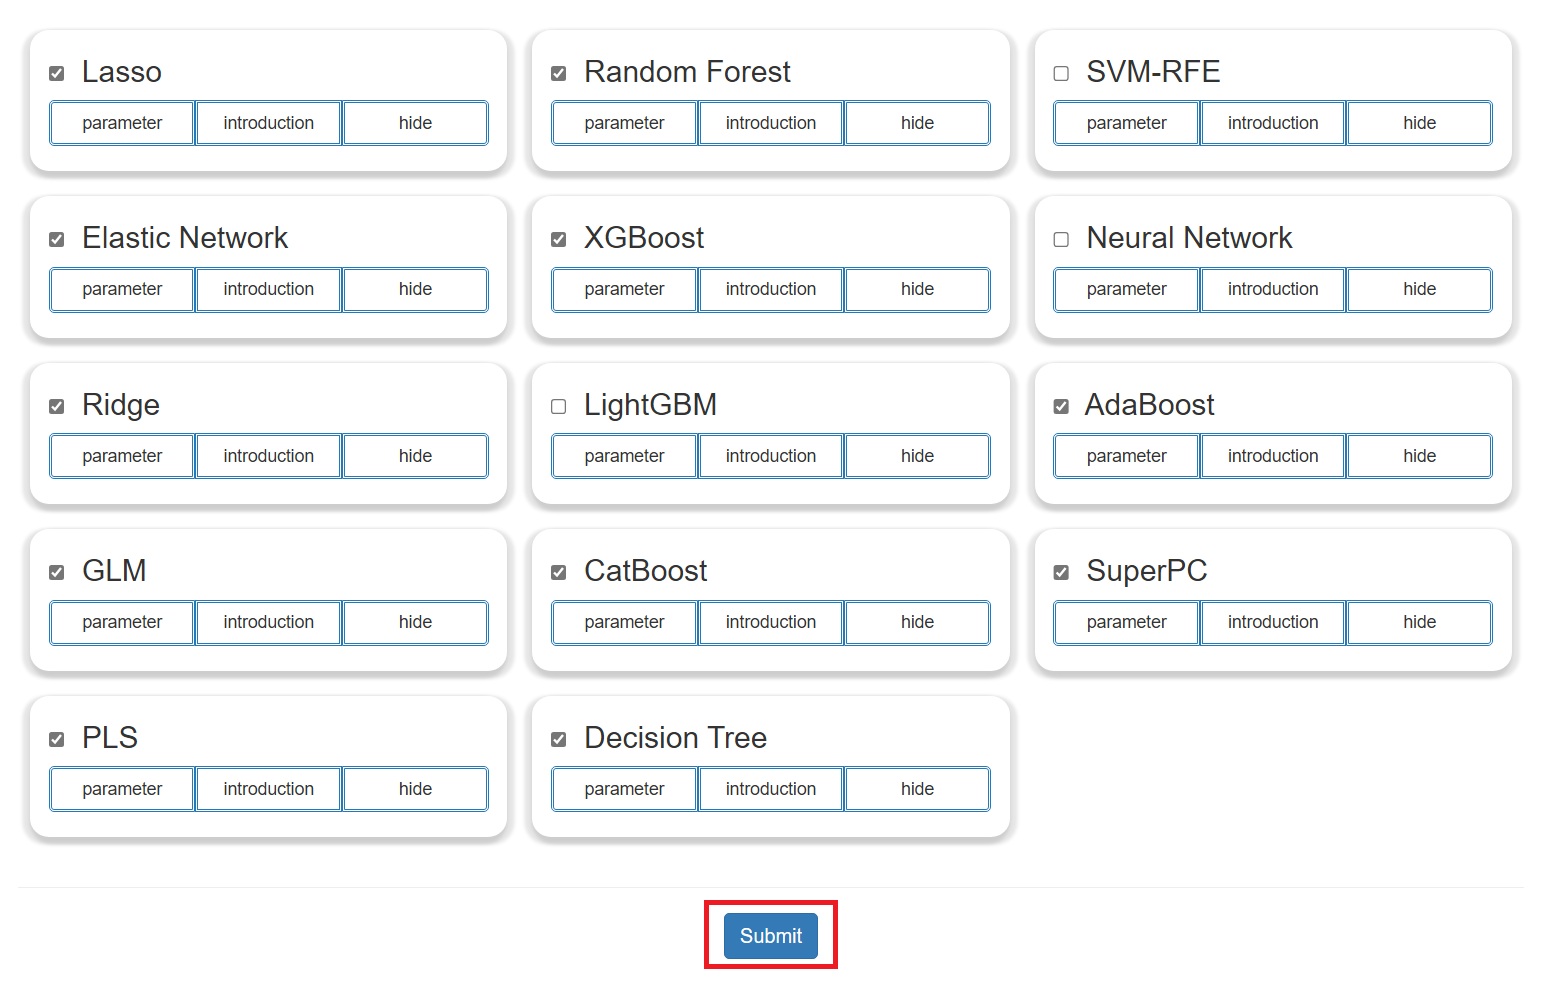
- Users can choose the machine learning algorithm of interest for analysis.
- Click the "parameter" button to display the optional parameters of the corresponding method for users to adjust.
- Click the "introduction" button to show a simple description of the method.
- Click the "submit" button to perform the analysis of the "Biomarker Identification".
Step 3: The Promotion of the Analysis Process.
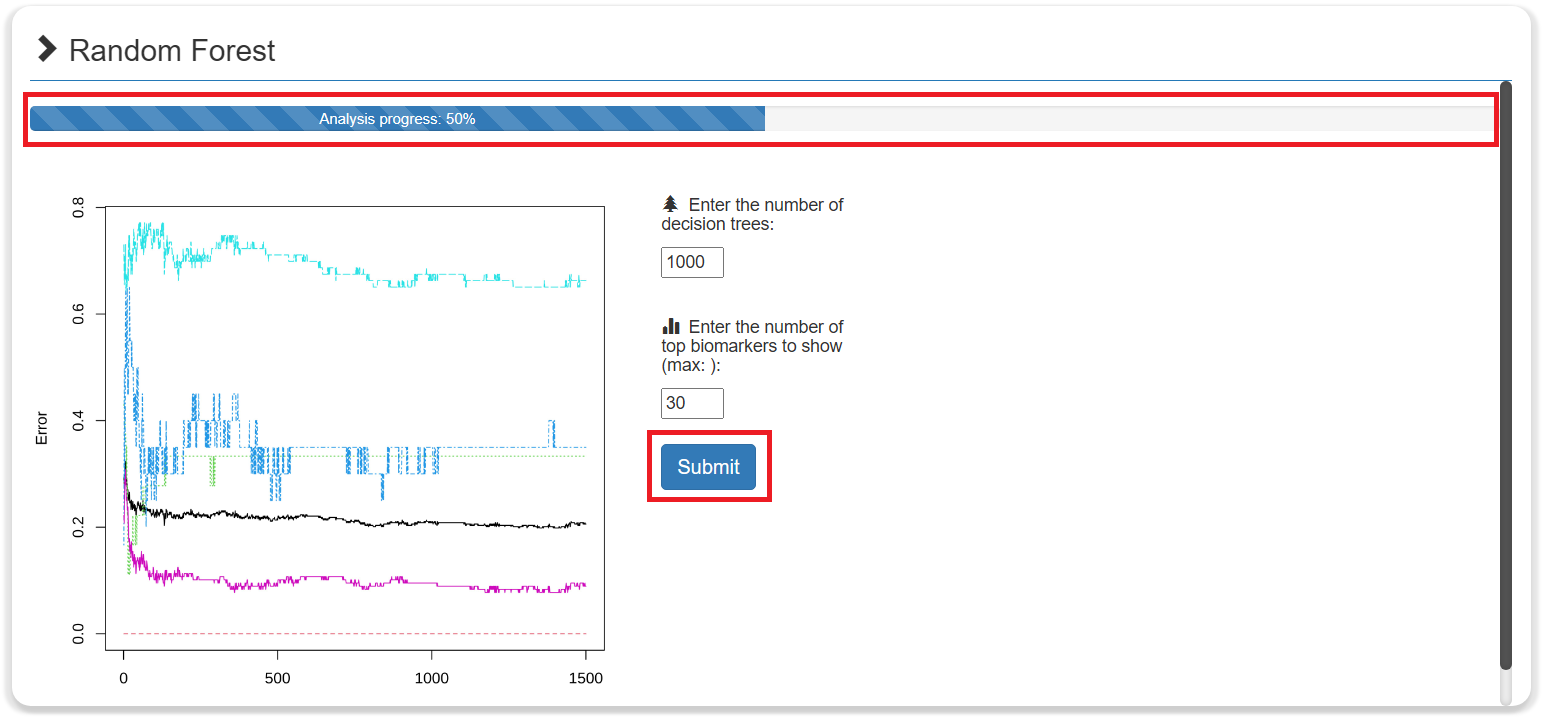
- Each ML method includes a progress bar in the analysis results. If the progress bar is not 100%, it means that the analysis requires further action by users.
- Each method includes a progress bar in the analysis results. If the progress bar is not 100%, it means that the analysis requires further action by users.
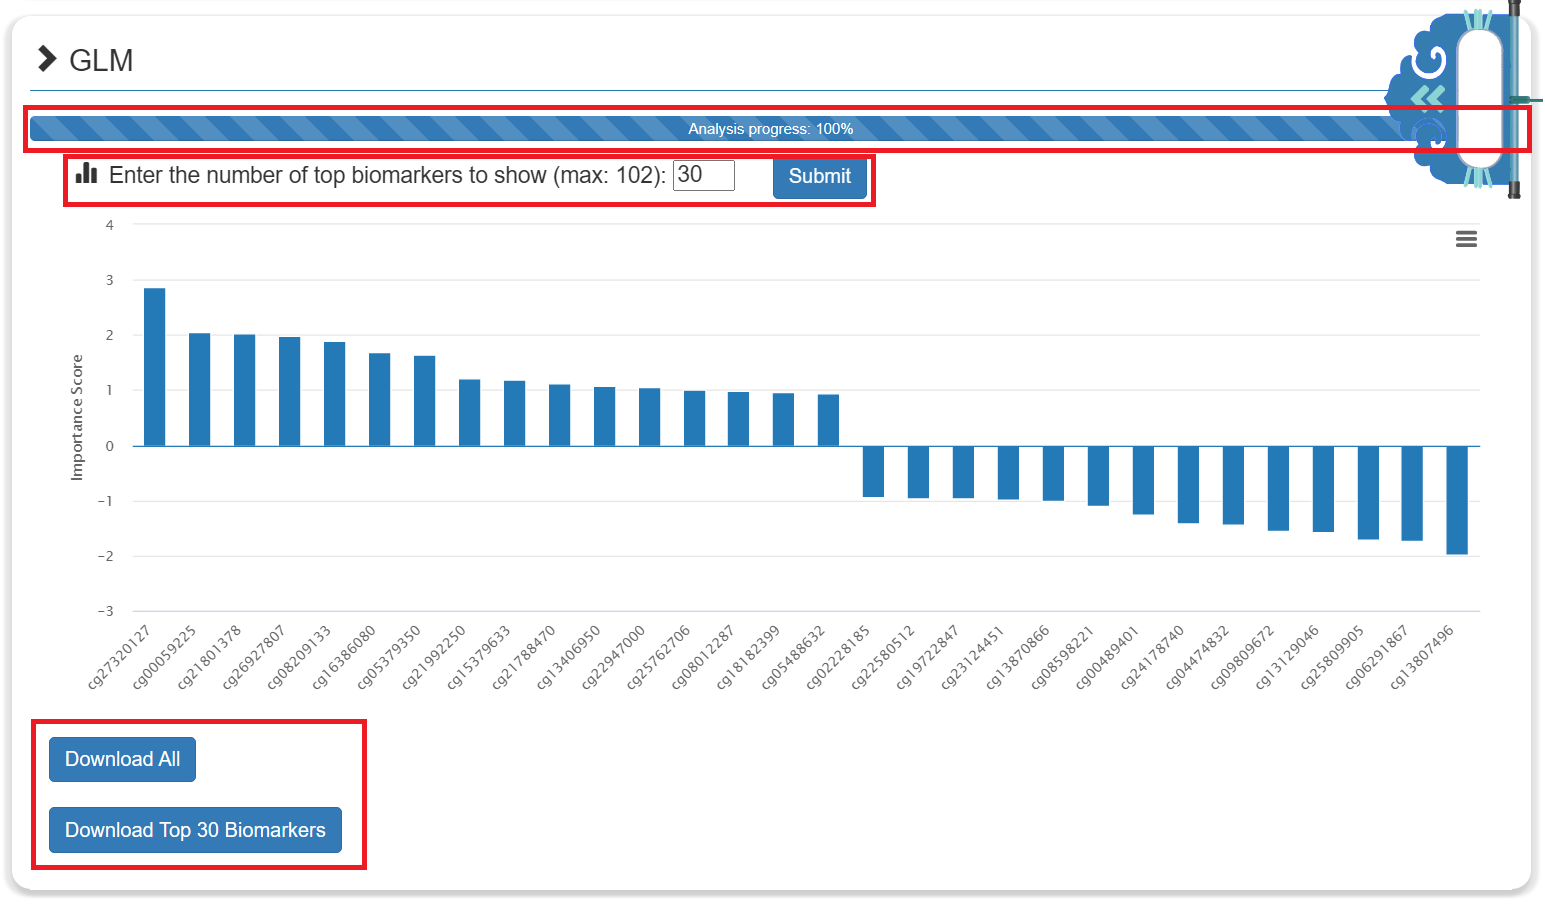
- The results of each ML method included a histogram showing the importance score of the biomarkers in the model. The larger the absolute value of the importance score, the more important the biomarker. The user can select a threshold to set the number of displays and use it for subsequent analysis.
- The results of each ML method can be downloaded for free.
Step 4: Browse Analysis Results of All ML Methods
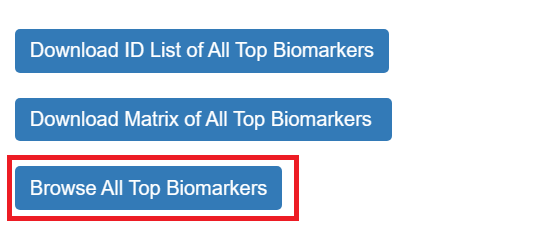
- Under the analysis results of "Biomarker Identfication", users can click the button of "Browse All Top Biomarkers" to view the analysis results of all ML methods.
- The browsing results included a table of all biomarkers and a upset chart to show their intersection and combination.
- Users can select biomarkers of interest and browse their data distribution in the training set.
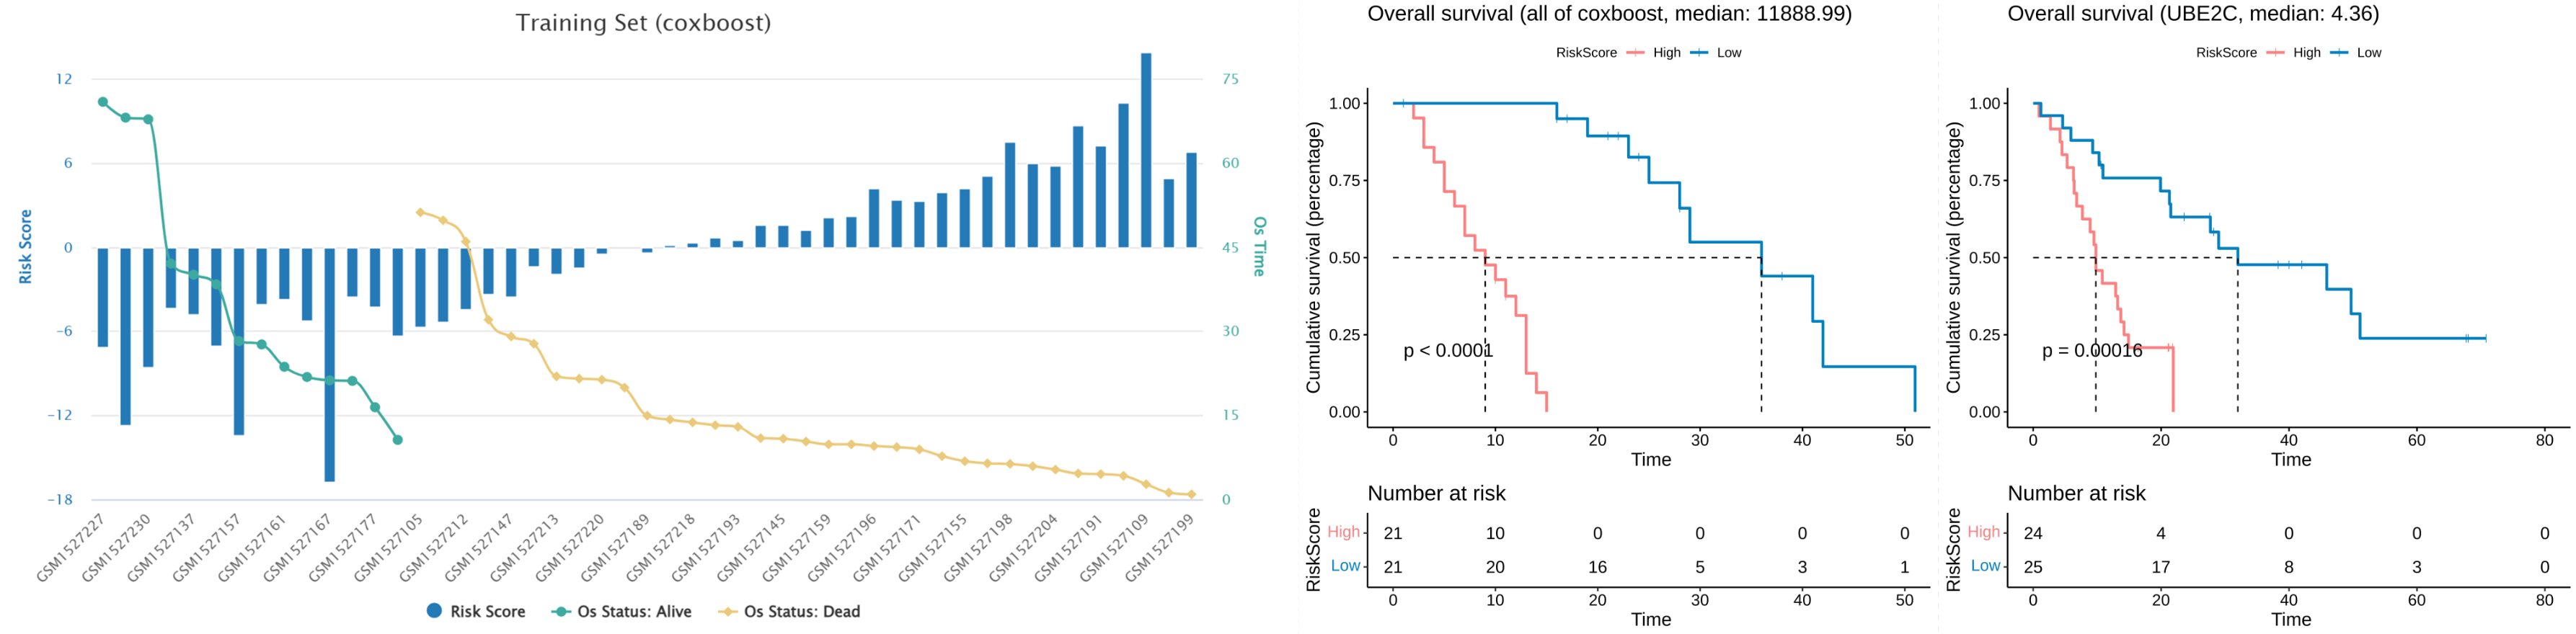
- If users is performing a survival analysis, it is also possible to show the risk assessment status of the training set sample in the model. And users can browse the KM (Kaplan-Meier) analysis results of the MLmethod or biomarker of interest.
Biomarker Evaluation
Step 1: Data Input and Parameter Selection
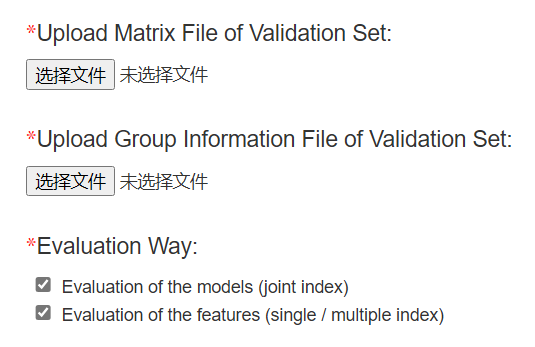
- Click the button in the upper right hover box, and an embedded page will appear that allows users to upload validation sets for model/biomarker evaluation.
- The content and order of features in the validation set should be consistent with those in the training set uploaded before, otherwise there will be no results or no associated AUC / C-index value.
- The file format of validation set should be the same as that of the training set.
Step 2: The Results of the Evaluation of the Models / Biomarkers
Binary-class
- The analysis results of binary-class included the evaluation of the model (left) and the evaluation of the biomarker (right).
- The results of model evaluation include the AUC (area under the curve) values of each model and the comparison between the predicted values and the true values. Users can choose the ML methods of interest to visualize AUC values and ROC curves.
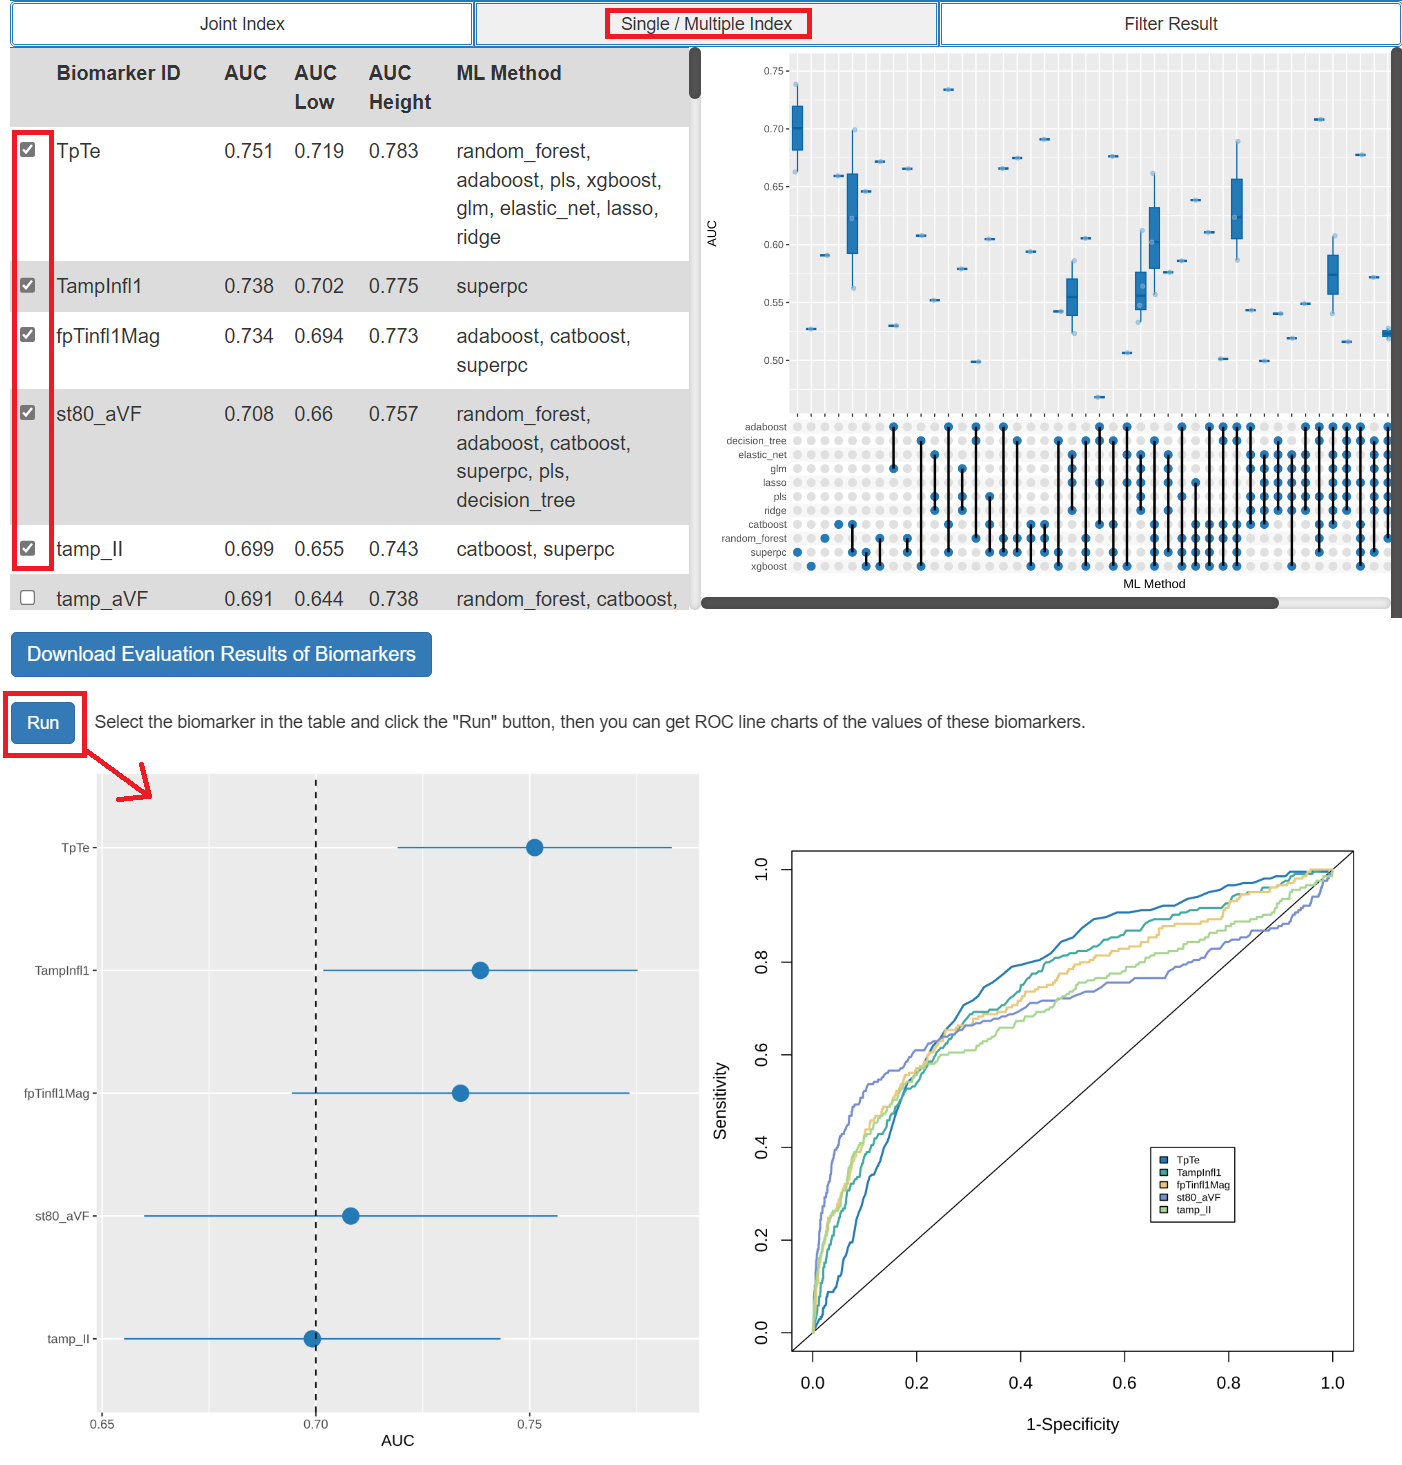
- The results of biomarker evaluation include the AUC values of each biomarker. Users can choose the biomarkers of interest to visualize AUC values and ROC curves.
Multi Class
- The analysis results of multi class included the evaluation of the model (left) and the evaluation of the biomarker (right).
- For model evaluation of multi class analysis, MLBiomarker provides two reference indicators to measure the model. The first reference is the AUC value calculated by ROC analysis based on the validation set. Users can choose the ML method of interest to browse AUC values in more detail. The second reference is the R square calculated from the correlation analysis between the predicted and actual values.
- The results of biomarker evaluation include the AUC values of each biomarker. Users can choose the biomarkers of interest to browse AUC values in more detail.
Survival Analysis
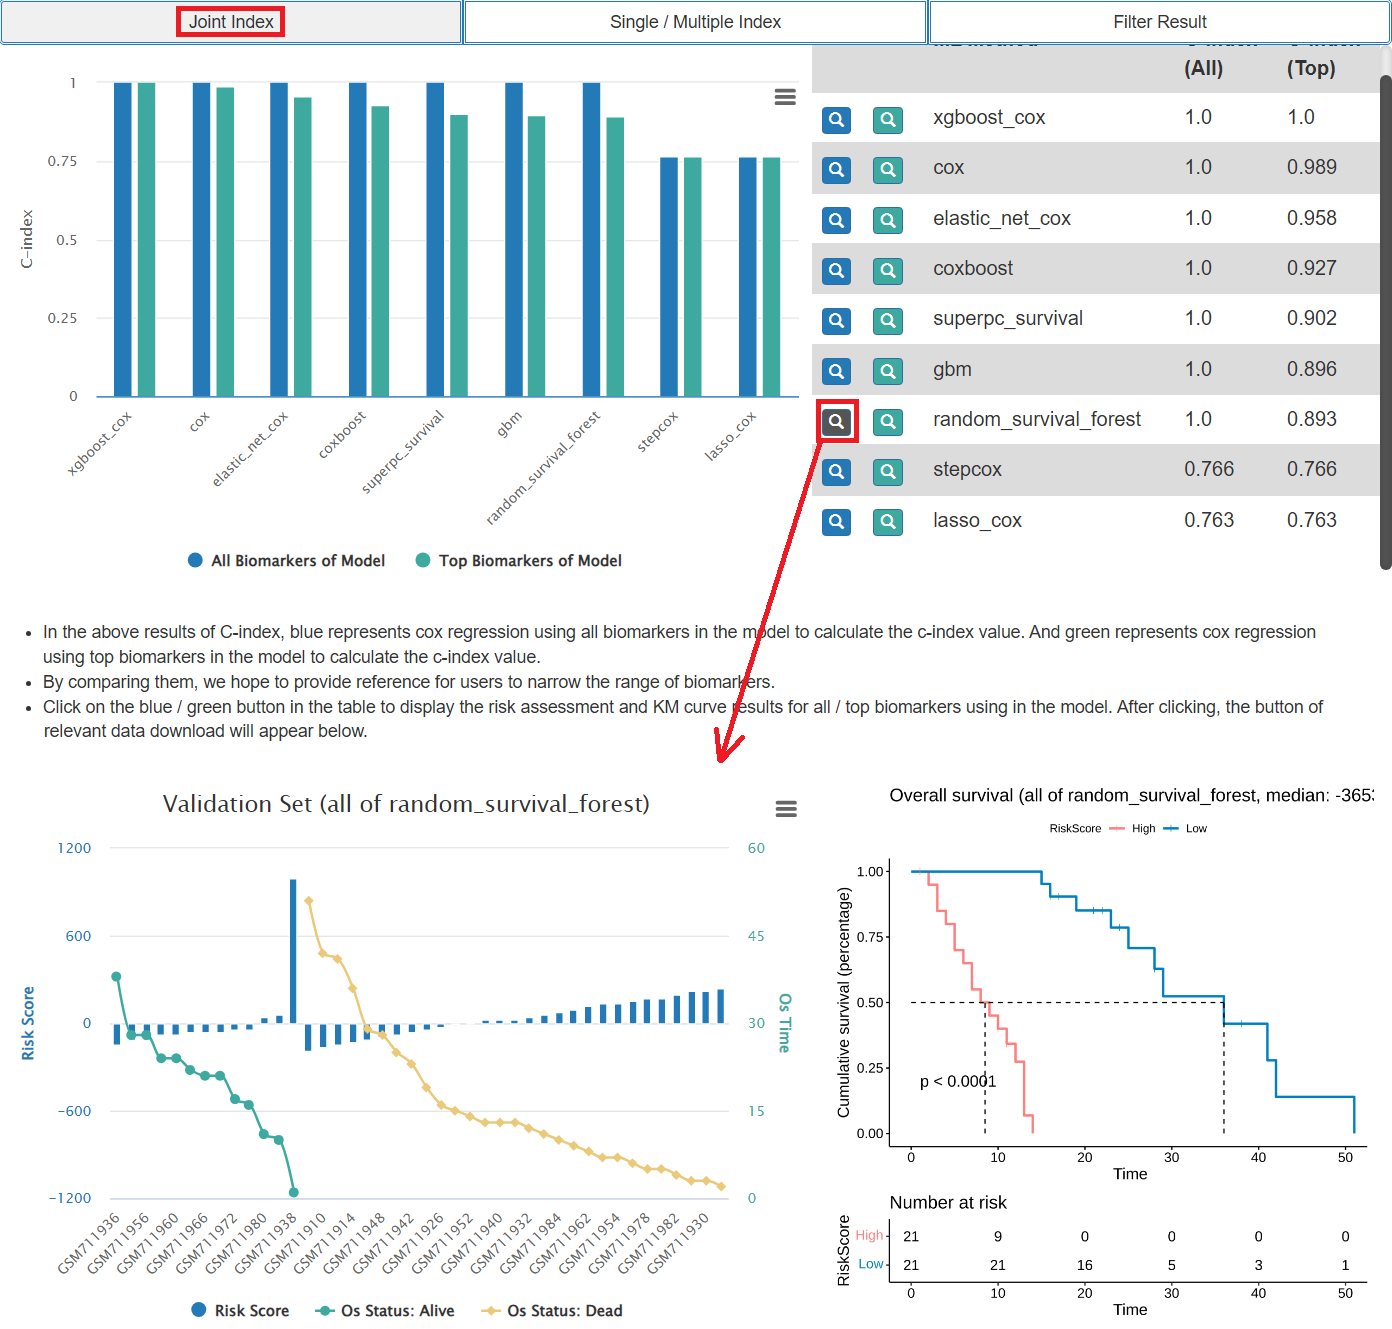
- The results of survival analysis included the evaluation of the model (left) and the evaluation of the biomarker (right).
- The results of model evaluation include the C-index (concordance index) values of each model and the C-index values of each sets of top biomarker. Users can choose the ML method of interest to show the result of KM analysis and risk assessment results of the validation set samples.
- The results of biomarker evaluation include the C-index values of each biomarker. Users can choose the biomarkers of interest to visualize the C-index value and browse the KM analysis results of them.
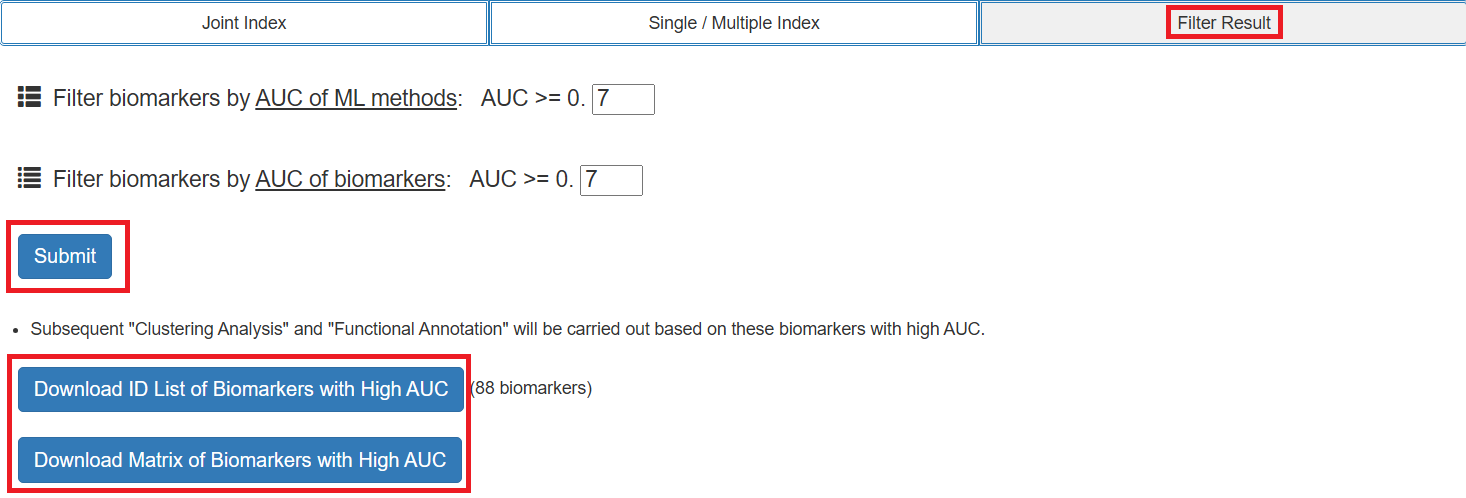
Step 3: Filter According to the Evaluation Results
- Users can set thresholds for evaluation results for filtering and visualization.
- Filtered results can be downloaded for free.
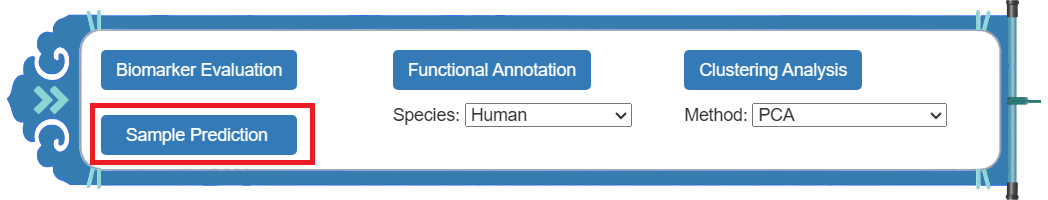
Sample Prediction
Step 1: Data Input and Parameter Selection
- Click the button in the upper right hover box, and an embedded page will appear that allows users to upload prediction sets for sample prediction.
- The content and order of features in the prediction set should be consistent with those in the training set uploaded before.
- The file format of prediction set should be the same as that of the training set.
Step 2: The Results of Sample Prediction
- The prediction results contain a table of predicted phenotypes for all samples. The corresponding proportion can be understood by the accumulation bar chart.
- If users is performing a survival analysis, the outcome of the sample risk prediction and the risk score are included in the prediction results. Considering that there may be sample differences and batch effects between the training set and the prediction set, the relative size of the risk scores among each sample may be more valuable for reference diagnosis. For example, in the prediction results of StepCox on the right, sample GSM711906 has a higher risk of disease than sample GSM711916.
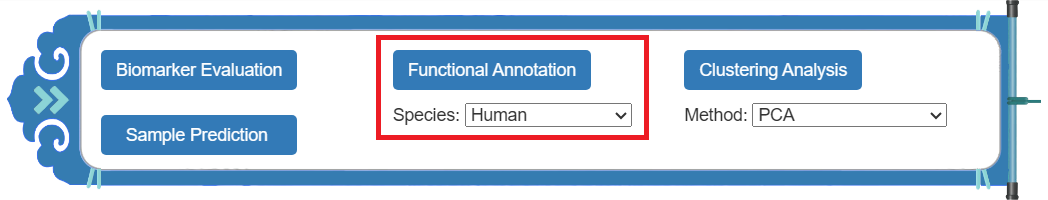
Functional Annotation
Step 1: Run the Analysis Program
- Click the button in the upper right hover box to perform the analysis of functional annotation.
- This module requires that the features in the uploaded file must be gene symbol.
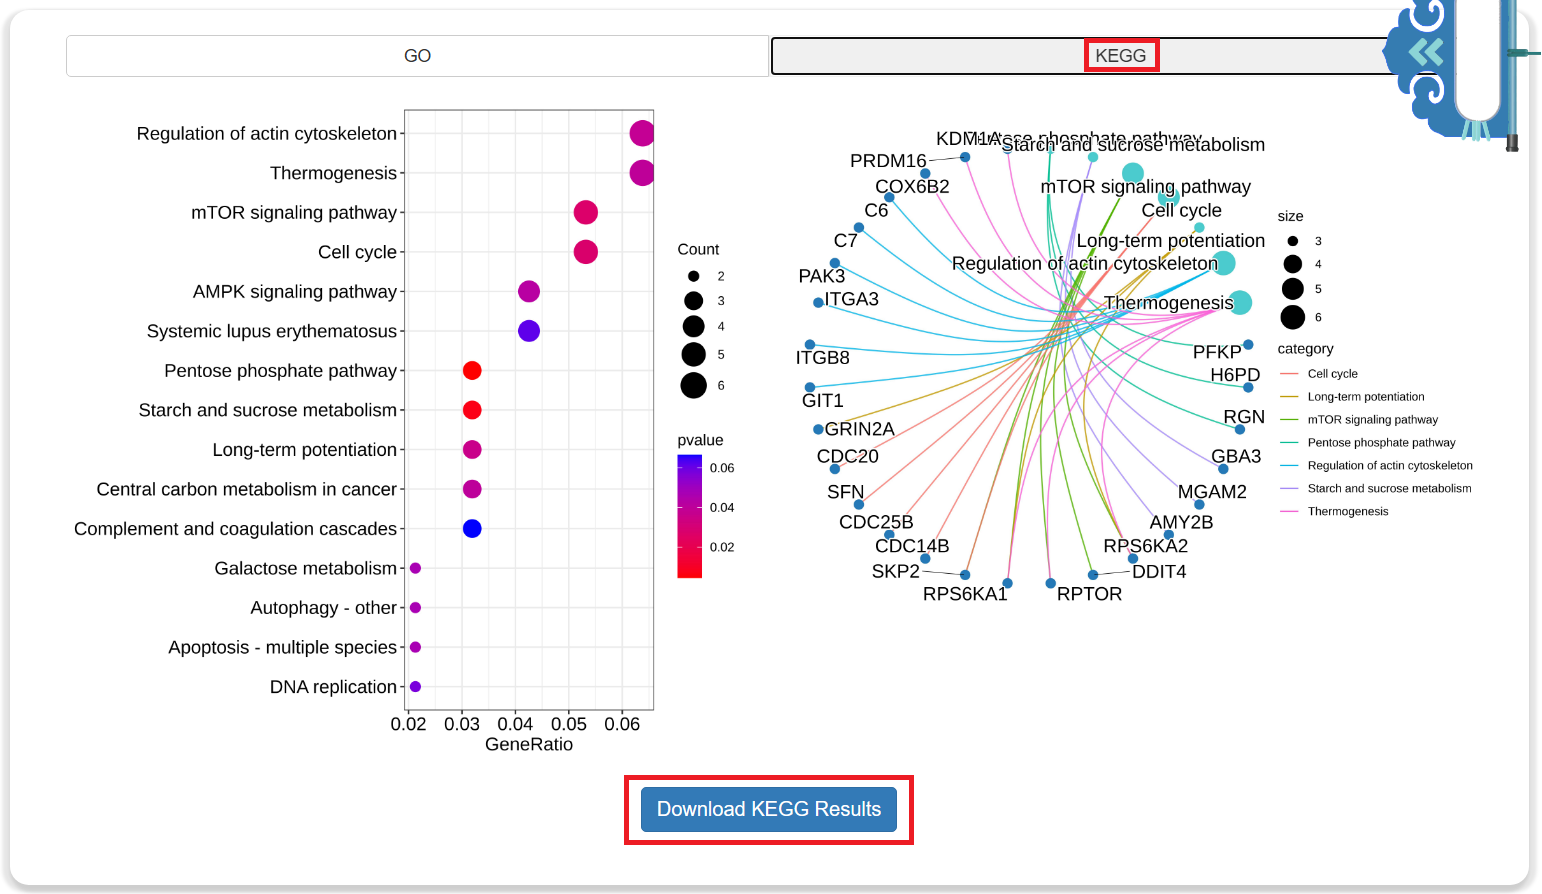
Step 2: The Results of Functional Annotation
- The results of functional annotation include GO (Gene Ontology) and KEGG (Kyoto Encyclopedia of Genes and Genomes). Click the button to download them for free.
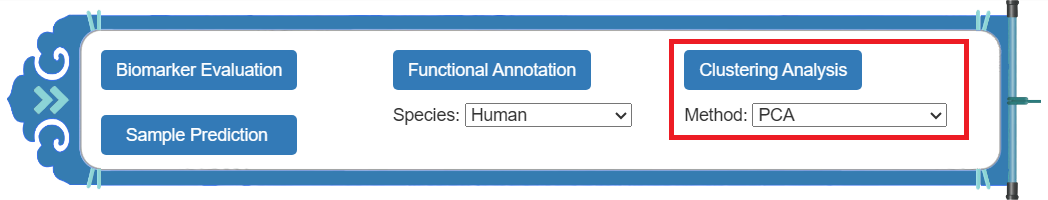
Clustering Analysis
Step 1: Run the Analysis Program
- Click the button in the upper right hover box to perform the analysis of clustering analysis.
- MLBiomarker provides 7 methods of clustering analysis for users to choose from.
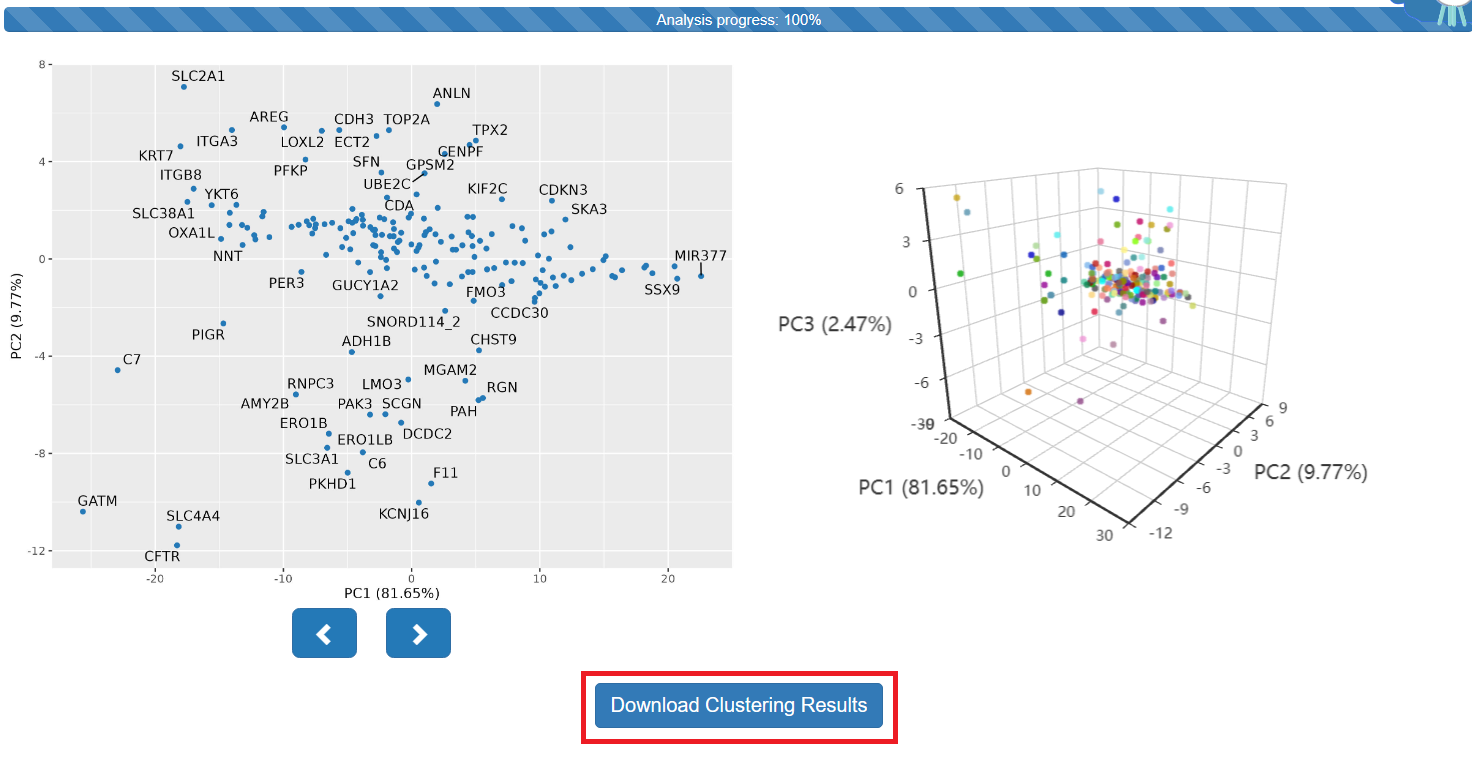
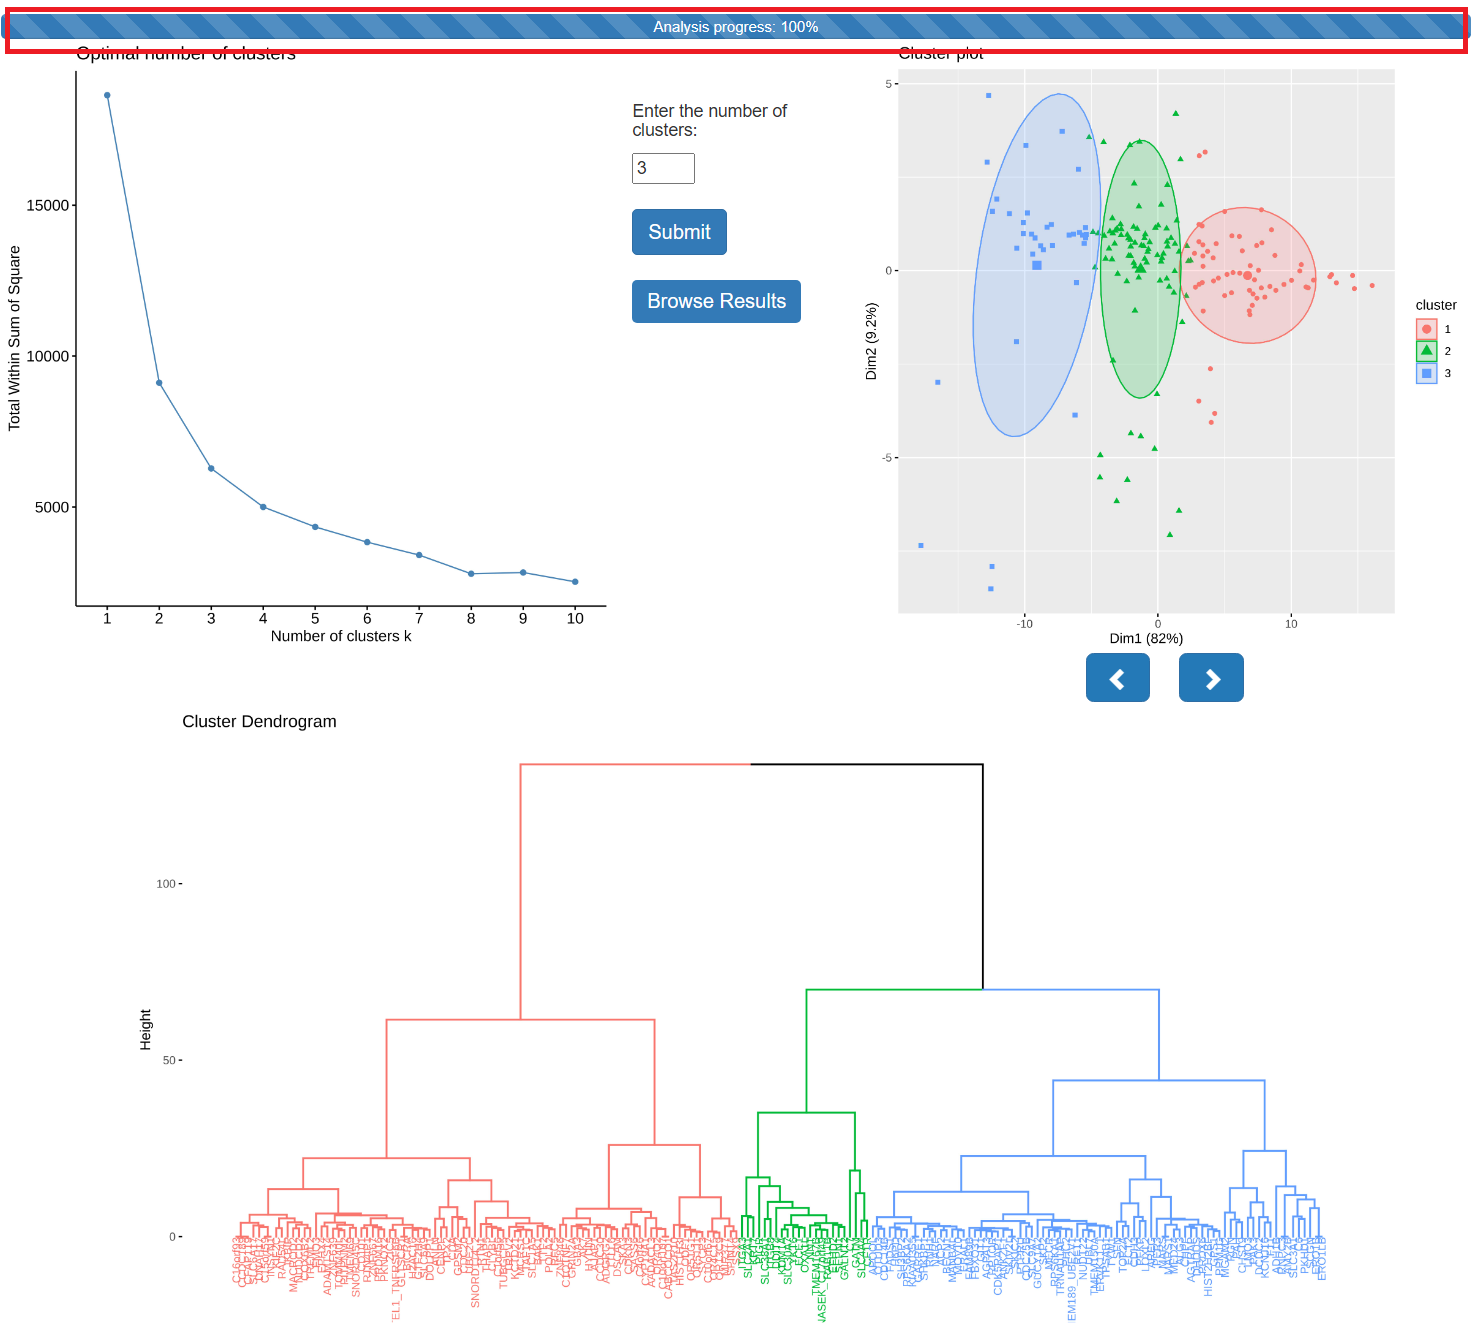
Step 2: The Results of Clustering Analysis
- The figure above shows the results of PCA (principal component analysis). Click the button to download them for free.
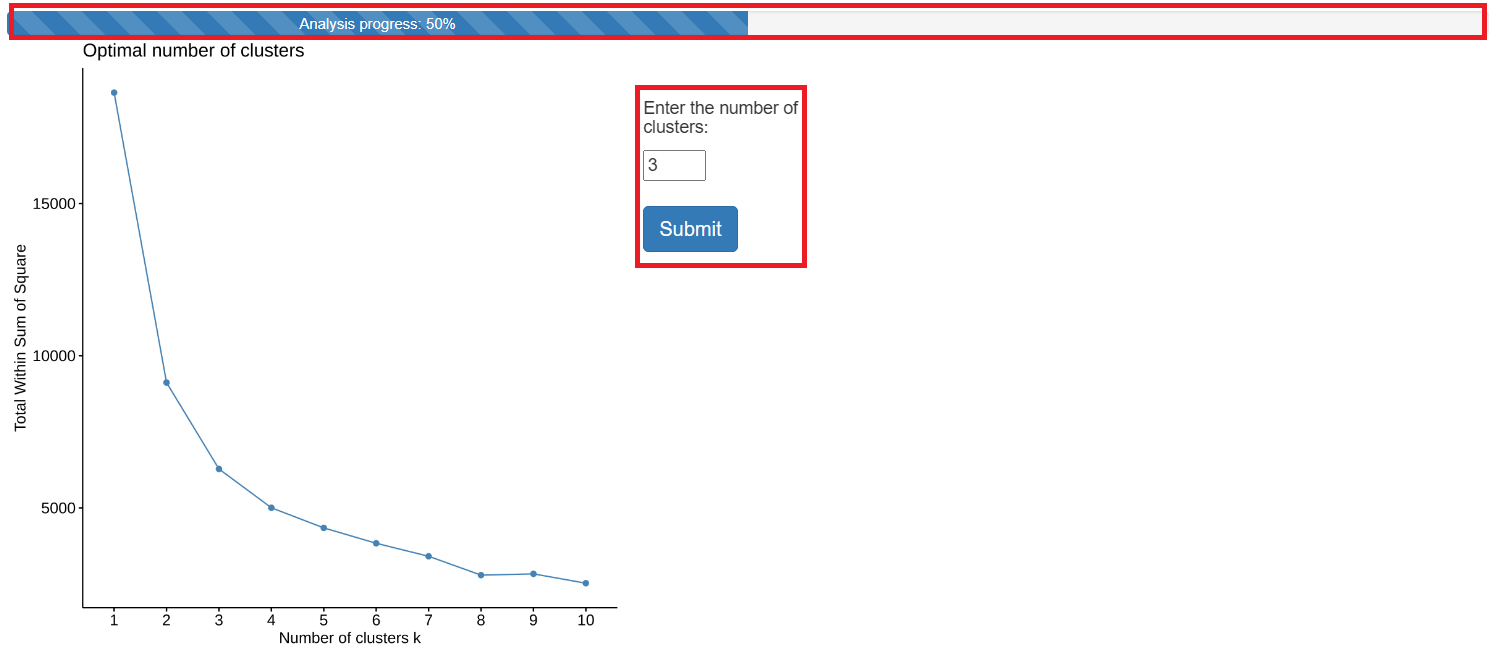
- The following figure shows the result of Hierarchical K-Means. As shown in the figure, when the progress bar is not 100%, the user is required to further fill out the form and click the submit button. The final results are shown on the right.
Step 3: Functional Annotation for Specified Cluster
- When the feature type of the uploaded data is gene, users can select the cluster of interest for functional analysis.
- Users can select cluster by entering the coordinates or entering the id of the cluster.
- The result form of the functional annotation is the same as previously mentioned.
Comparison with the Original Articles
Binary-class
-
Reference:
DOI:10.1038/s41591-023-02396-3
- The top half of the figure below shows the results of the evaluation of the models. Among them, Random forest, XGBoost, LightGBM and AdaBoost have the best evaluation effect, with AUC values above 0.75, and the accuracy of their prediction results above 90%.
- Although the prediction results of Ridge, PLS, Lasso and other methods show certain accuracy, the prediction results of case samples show a very high error rate, so the models constructed by these methods are not reliable. The corresponding AUC value is only about 0.5, which does not have the ability to predict.
- The bottom half of the figure below shows the ranking of the most important biomarkers in the original study among the MLBiomarker analysis results.
- In the study of Al-Zaiti et al., Random forest also stands out among 10 machine learning methods and achieves the best evaluation effect. Moreover, biomarkers such as st80_III, st80_aVL, STT_PCAratio, st80_V2, and TpTe not only rank among the top ten in the research results of Al-Zaiti et al, but also they rank high in importance among the analysis results of various methods in MLBiomarker.
Multi-class
-
Reference:
DOI:10.1186/gb-2014-15-2-r24
- In the evaluation results, the performance of all models has reached a good evaluation effect.
- There are 12 methods with AUC values above 0.9, and the relatively low Decision tree and CatBoost are as high as 0.89 and 0.85.
- The correlation R square of all models also reached a high level, and the relatively low Neural network and Decision tree were as high as 0.89 and 0.87, indicating that these models had a high consistency between the predicted age of the validation set sample and its real age.
- CpG loci such as g09809672, cg25809905, cg15379633, cg02228185, cg16386080, cg23124451, cg15804973 not only ranked among the top ten in the model reported by Carola et al, but also ranked among the top in the weight of multiple models in MLBiomarker, which means the consistency of the analysis results of both sides.
Survival Analysis
-
Reference:
DOI:10.1158/1078-0432.CCR-16-0511
(Training set),
DOI:10.1158/1078-0432.CCR-13-0209
(Validation set)
- The figure on the right shows the biomarkers derived from Wang's analysis. The figure on the left shows the distribution of these genes in MLBiomarker analysis.
- The biomarkers identified by plsRcox, Ridge, SuperPC survival, and Random survival forest models was highly consistent with the results obtained by Wang et al. And these genes are generally ranked high in the weight of SuperPC survival results, showing the consistency of the results of both studies.
- We selected the top 30 most important genes in each model as top biomarkers, and obtained a set of top biomarkers with 210 genes. Among them, KRT7, SFN, ITGA3, TPX2, LOXL2 and other genes were also identified as biomarkers of pancreatic cancer by Wang et al. In addition, although CDA, HK1, ADAMTS14 and other genes were not included in the analysis results of Wang et al., they were also reported as key genes related to pancreatic cancer.