Introduction
Analysis process
0
Others
1
Quick start 1. Video
This video (we strongly recommend that you watch this tutorial before using it!) vividly demonstrates the use of online methylome analysis with built-in data support. Given the step-by-step nature of the tool, users can follow the video to recreate the operation. You can also get a detailed description in the "HELP -> Usage -> Methylation analysis" section.
Quick start 2. Processing flow
Users need to pay attention to three points when conducting online analysis in the direction of the arrow. 1. Samples cannot be selected across species, and it is not recommended to combine RRBS and WBS for analysis. 2. Batch effect removal is also optional. 3. The email address is optional, but we recommend that you fill it in. FishCODE will send the analysis results to the email address you specify. Regardless of whether you fill in your email address,we will give you a URL to the results page.
Feature 1. Rich built-in data
We provide online methylation differential analysis supported by omics data. Users can combine FishCODE's rich built-in methylation data (61 data sets containing 1419 samples) with their own data to perform combined analysis with a high degree of freedom. These omics data covering a wide range of experimental conditions can also be freely explored individually.
Feature 2. DMRs/DEGs and corresponding visualization
This part not only supports global DMR search, but also performs annotation of DMR-associated DMGs by default. It is worth noting that users can visualize DMRs by clicking on the beginning of the row of DMRs on the task results page provided by FishCODE, or click on the gene column annotated in the row to jump to the detailed information page of the gene. example url
The adjustment panel will be automatically cleared When the user switches between different types of pictures for fine adjustment:
The adjustment panel will be automatically cleared When the fine-tuning button is clicked each time:
Q: Improper operation tips ?

A. This means that FishCODE did not detect the required user input or/and built-in data. B. This means that FishCODE did not detect that you uploaded a suitable experimental design form (“Design experiment” part) C. This means that FishCODE detects that the table in your "Design experiment" section is not sufficient (2 * 1), at least two groups and each group must have at least one samples.
Q: Are gene annotations of differentially methylated regions included in the results by default?
Yes, the annotated genes of DMRs will be given by default in FishCODE result emails and results pages. Users can set upstream and downstream gene distance limits in the "Analysis parameters" --> "Distance of associated genes" section. It is worth noting that the distance between upstream and downstream genes is optional, but genes containing DMRs are given by default.
Q: Why does my results page say "All steps have been completed, waiting for the results to be displayed" but there are still no visualizations or results available for download

Ajax on the result page automatically refreshes the page status. If your email has received the result, or the status has reached the last step normally, if there is still no result displayed on the page, just wait for a few seconds.
Q: Why are the results page DMRs and downloads normal, but the following visualization does not appear when clicking on the beginning of the line?
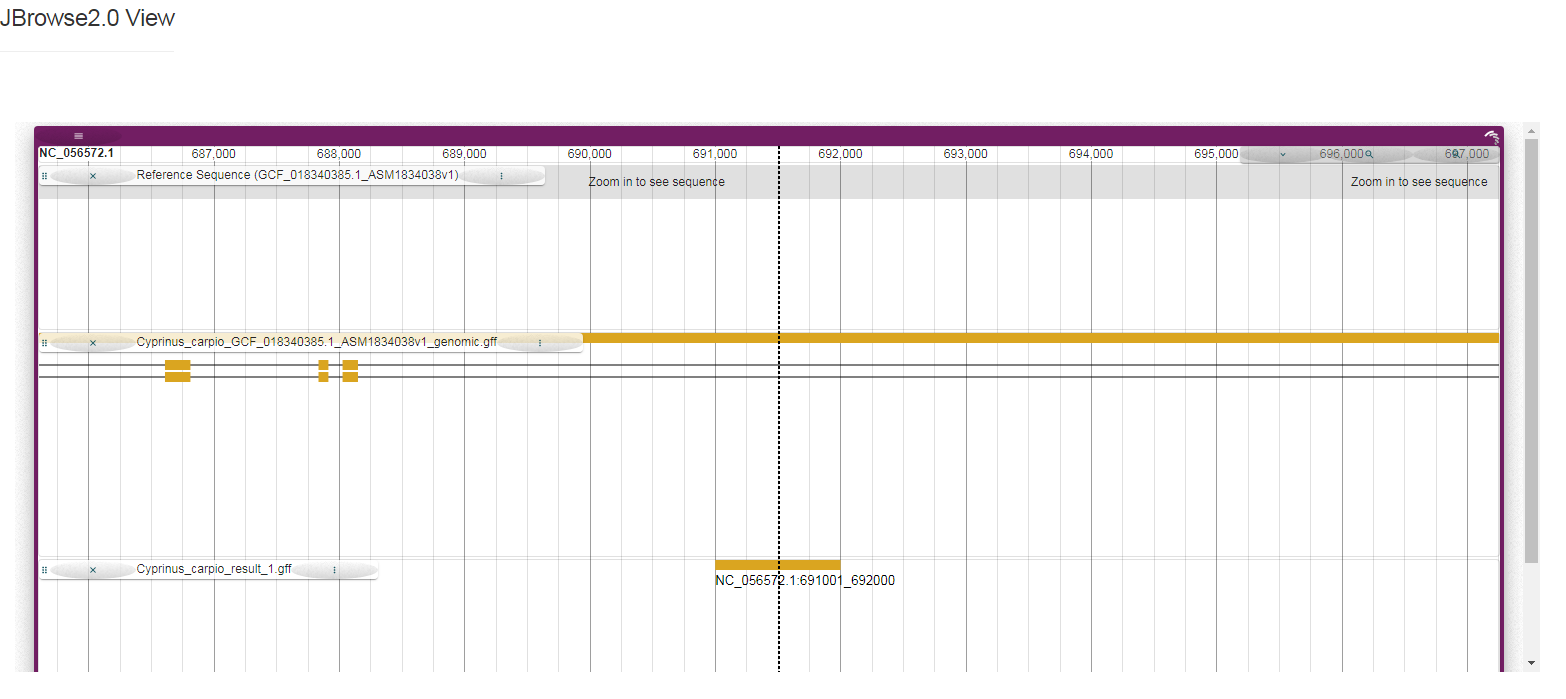
This visualization utilizes the JBrowse2 plug-in, and the task temporarily generates the corresponding visualization files of DMRs in gff format. Although we chose the most common sorting and indexing software to ensure the normal operation of this step, we do not rule out that some chromosomes cannot be sorted normally by gff3sort.pl, such as West African lungfish. If the visualization is abnormal, but the results are normal, you can use it with confidence.
Design experiment
(make sure to arrange at least two different groups, and each group should has at least one sample, for detailed operation, please watch this video)

Choose data
(you can choose built-in data or upload your own data, or both for joint analysis, for detailed operation, please watch this video)
Build-in datasets
Selectors (help users quickly find interesting data sets, select target species -> select experimental conditions of interest -> target data set)
Build-in datasets information (click on a row of items of interest)
Build-in sample Information (click on any sample row to mark it as selected (highlighted) and ready to enter the next step of analysis (click again to cancel the highlight))
Note: Only highlighted lines will be added.
Selected build-in samples (highlighted means selected, click again to deselect)
0
User's own datasets (Note: If you choose to upload your own data and merge it with the built-in data for analysis, the following two files must be uploaded)
|
1. [ Required ] Upload the file for gene epression information: Note: upload two template files one after another in order example file 1, example file 2 (Danio rerio, this sample file does not apply to other species), and does not support unicode type files. |
|---|
|
2. [ Required ] Upload the file for group information: Note: only supports csv, xls, xlsx, txt ( TAB-delimited ) as in the example file, and does not support unicode type files. |
0
[Required] this button should be clicked regardless of whether you upload your own data or not
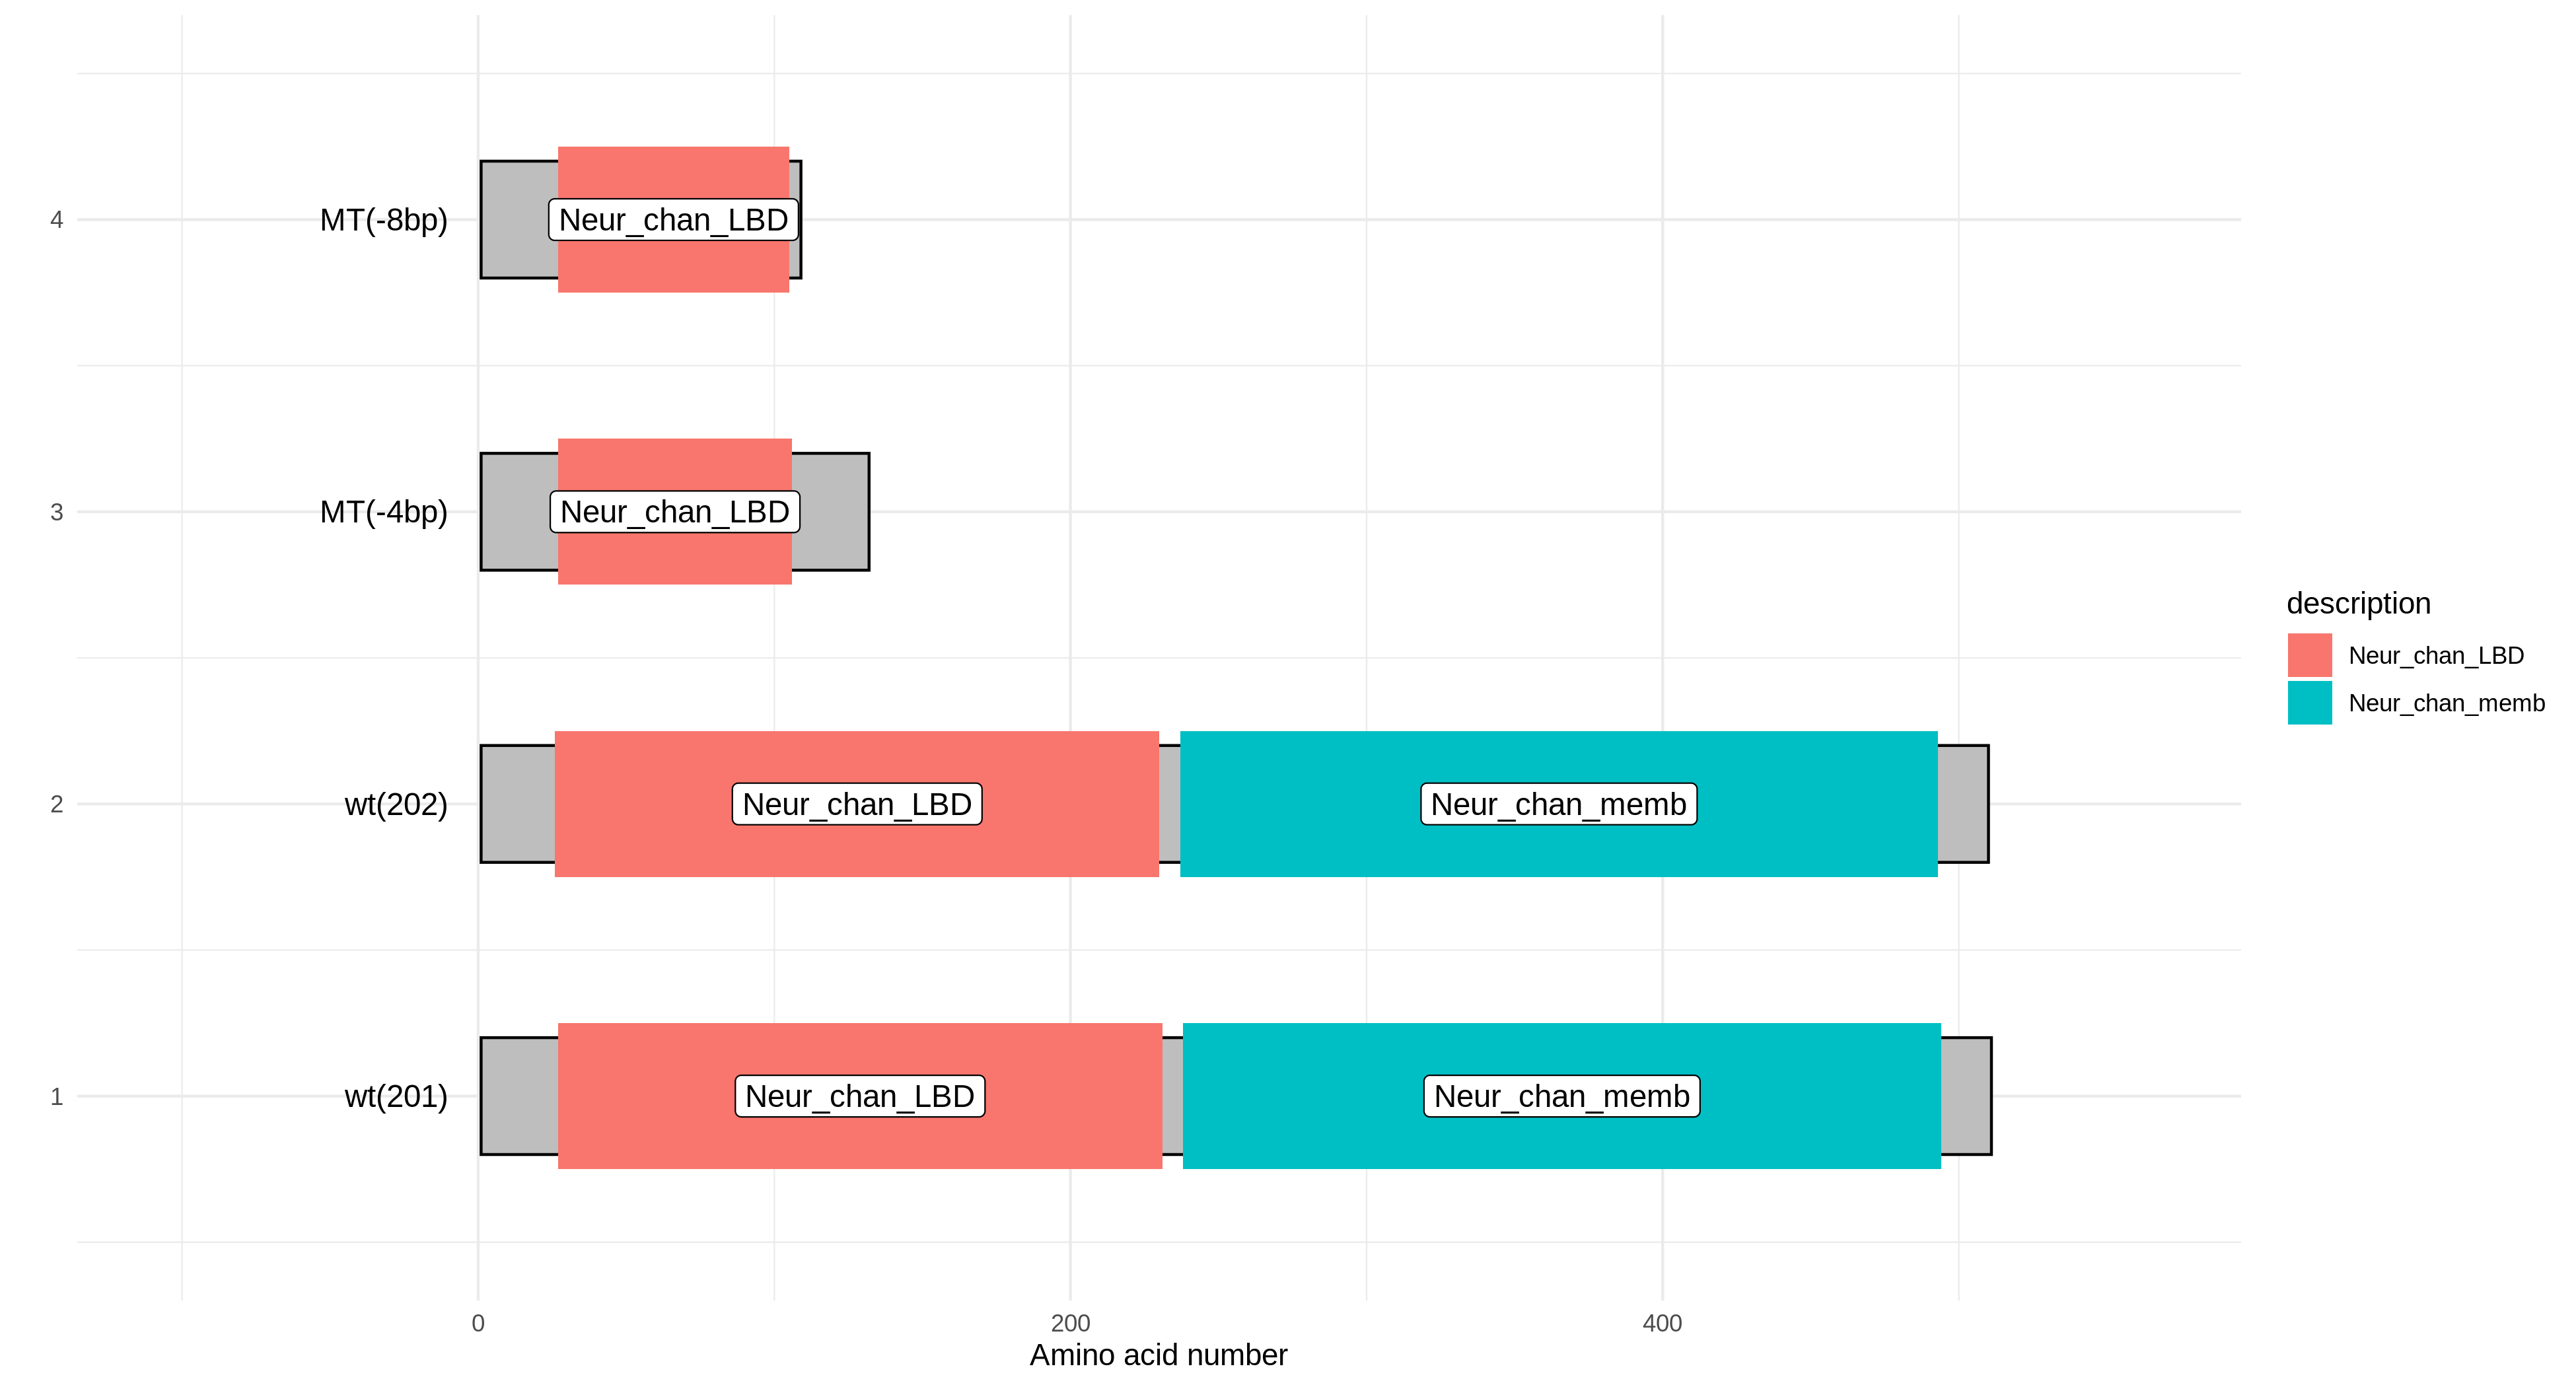
Protein Domain Prediction
The gene protein sequences entered by the user are aligned with the Pfam-A.hmm data, and then the alignment results are visualized based on the R package drawProteins.
|
1. [Required] Paste the file which like fasta file: Note: only supports fasta type file as in the example file. |
|---|
|
1. [ Required ] which contain colnum gene symbol or NCBI or Ensembl ID: Note: only supports fasta type file as in the example file, and does not support unicode type files. |
|---|
Analyze data
(after completing filling in the parameters, you can directly click the "Start running program" button to submit the task. for detailed operation, please watch this video)
Filter low-quality location site, more than
methylated reads and coverage lower than
Tile window analysis parameters, The window size is
, tStep size is
and minimum number of bases to be covered in a given window
Differential analysis parameters, qvalue is
, difference is
and type is
Distance of associated genes
Selecting ways to treat potential batch effects:
Note: within the same dataset, we recommend the option.
Note: FishCODE handles data from different sources as covariates
The explanation degree of this principal component is lower than
and is significantly less correlated with batch processing than
Note: FishCODE will automatically check the principal components that meet the user-set parameters (the proportion of interpretation of the principal components and the significance P value related to the batch effect). If there are any, they will be removed. Otherwise, the removal operation will not be performed.
[Optional] The email for receiving results :
Note: we recommend that you fill in this email so that FishCODE can send the result file to the designated email address. Of course, this is not necessary. The email is just to inform you more effectively that the running results have been completed.
[URL] The url address of your task:
Note: we recommend that you bookmark this URL address. Compared to email transmission, this page provides the function of visualizing and annotating gene connections of DMRs and DMGs, and you can also download the result file.
DE Analysis
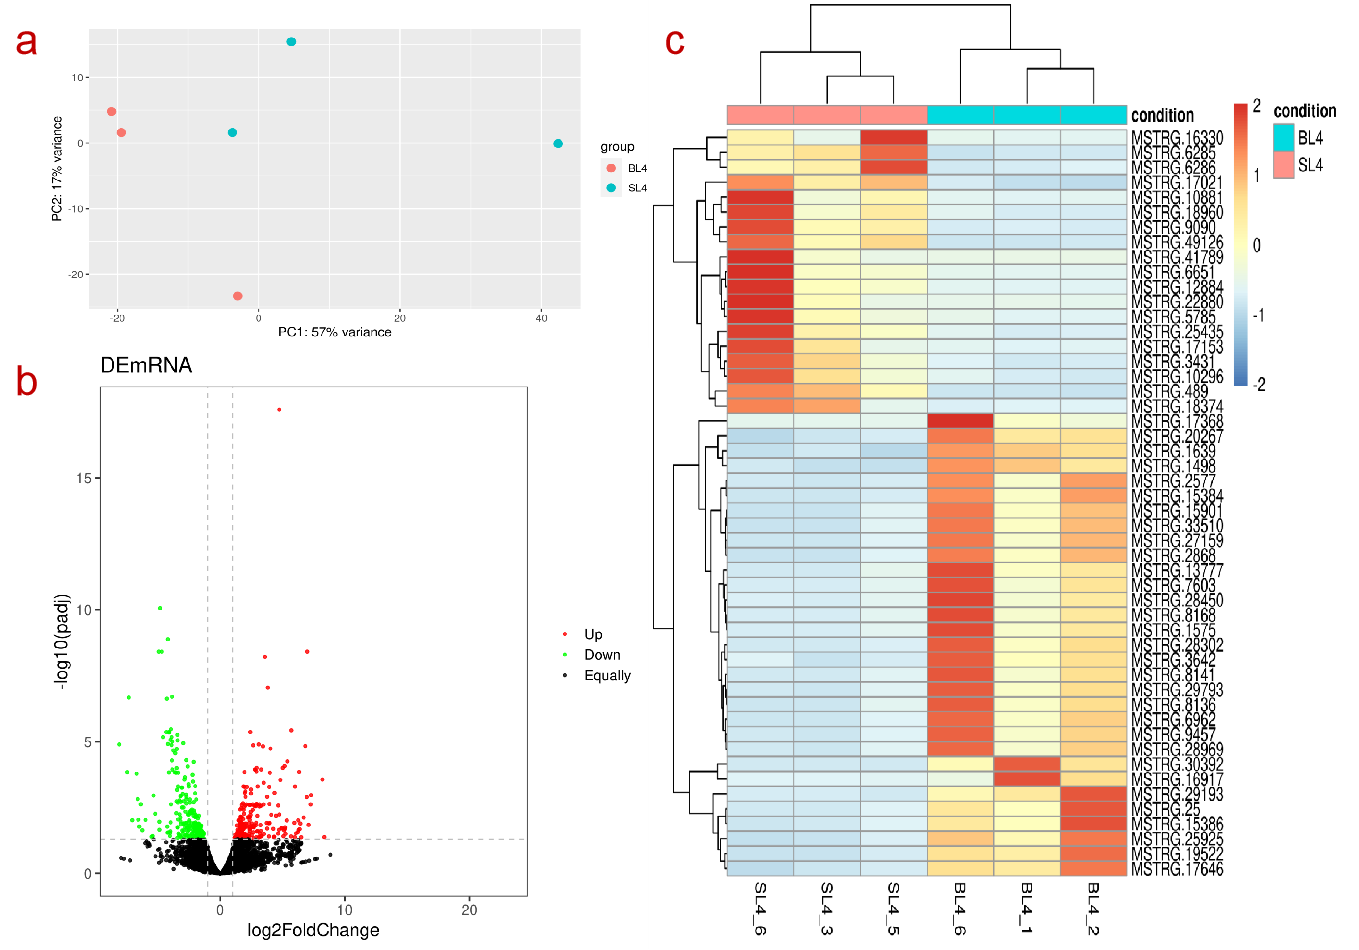
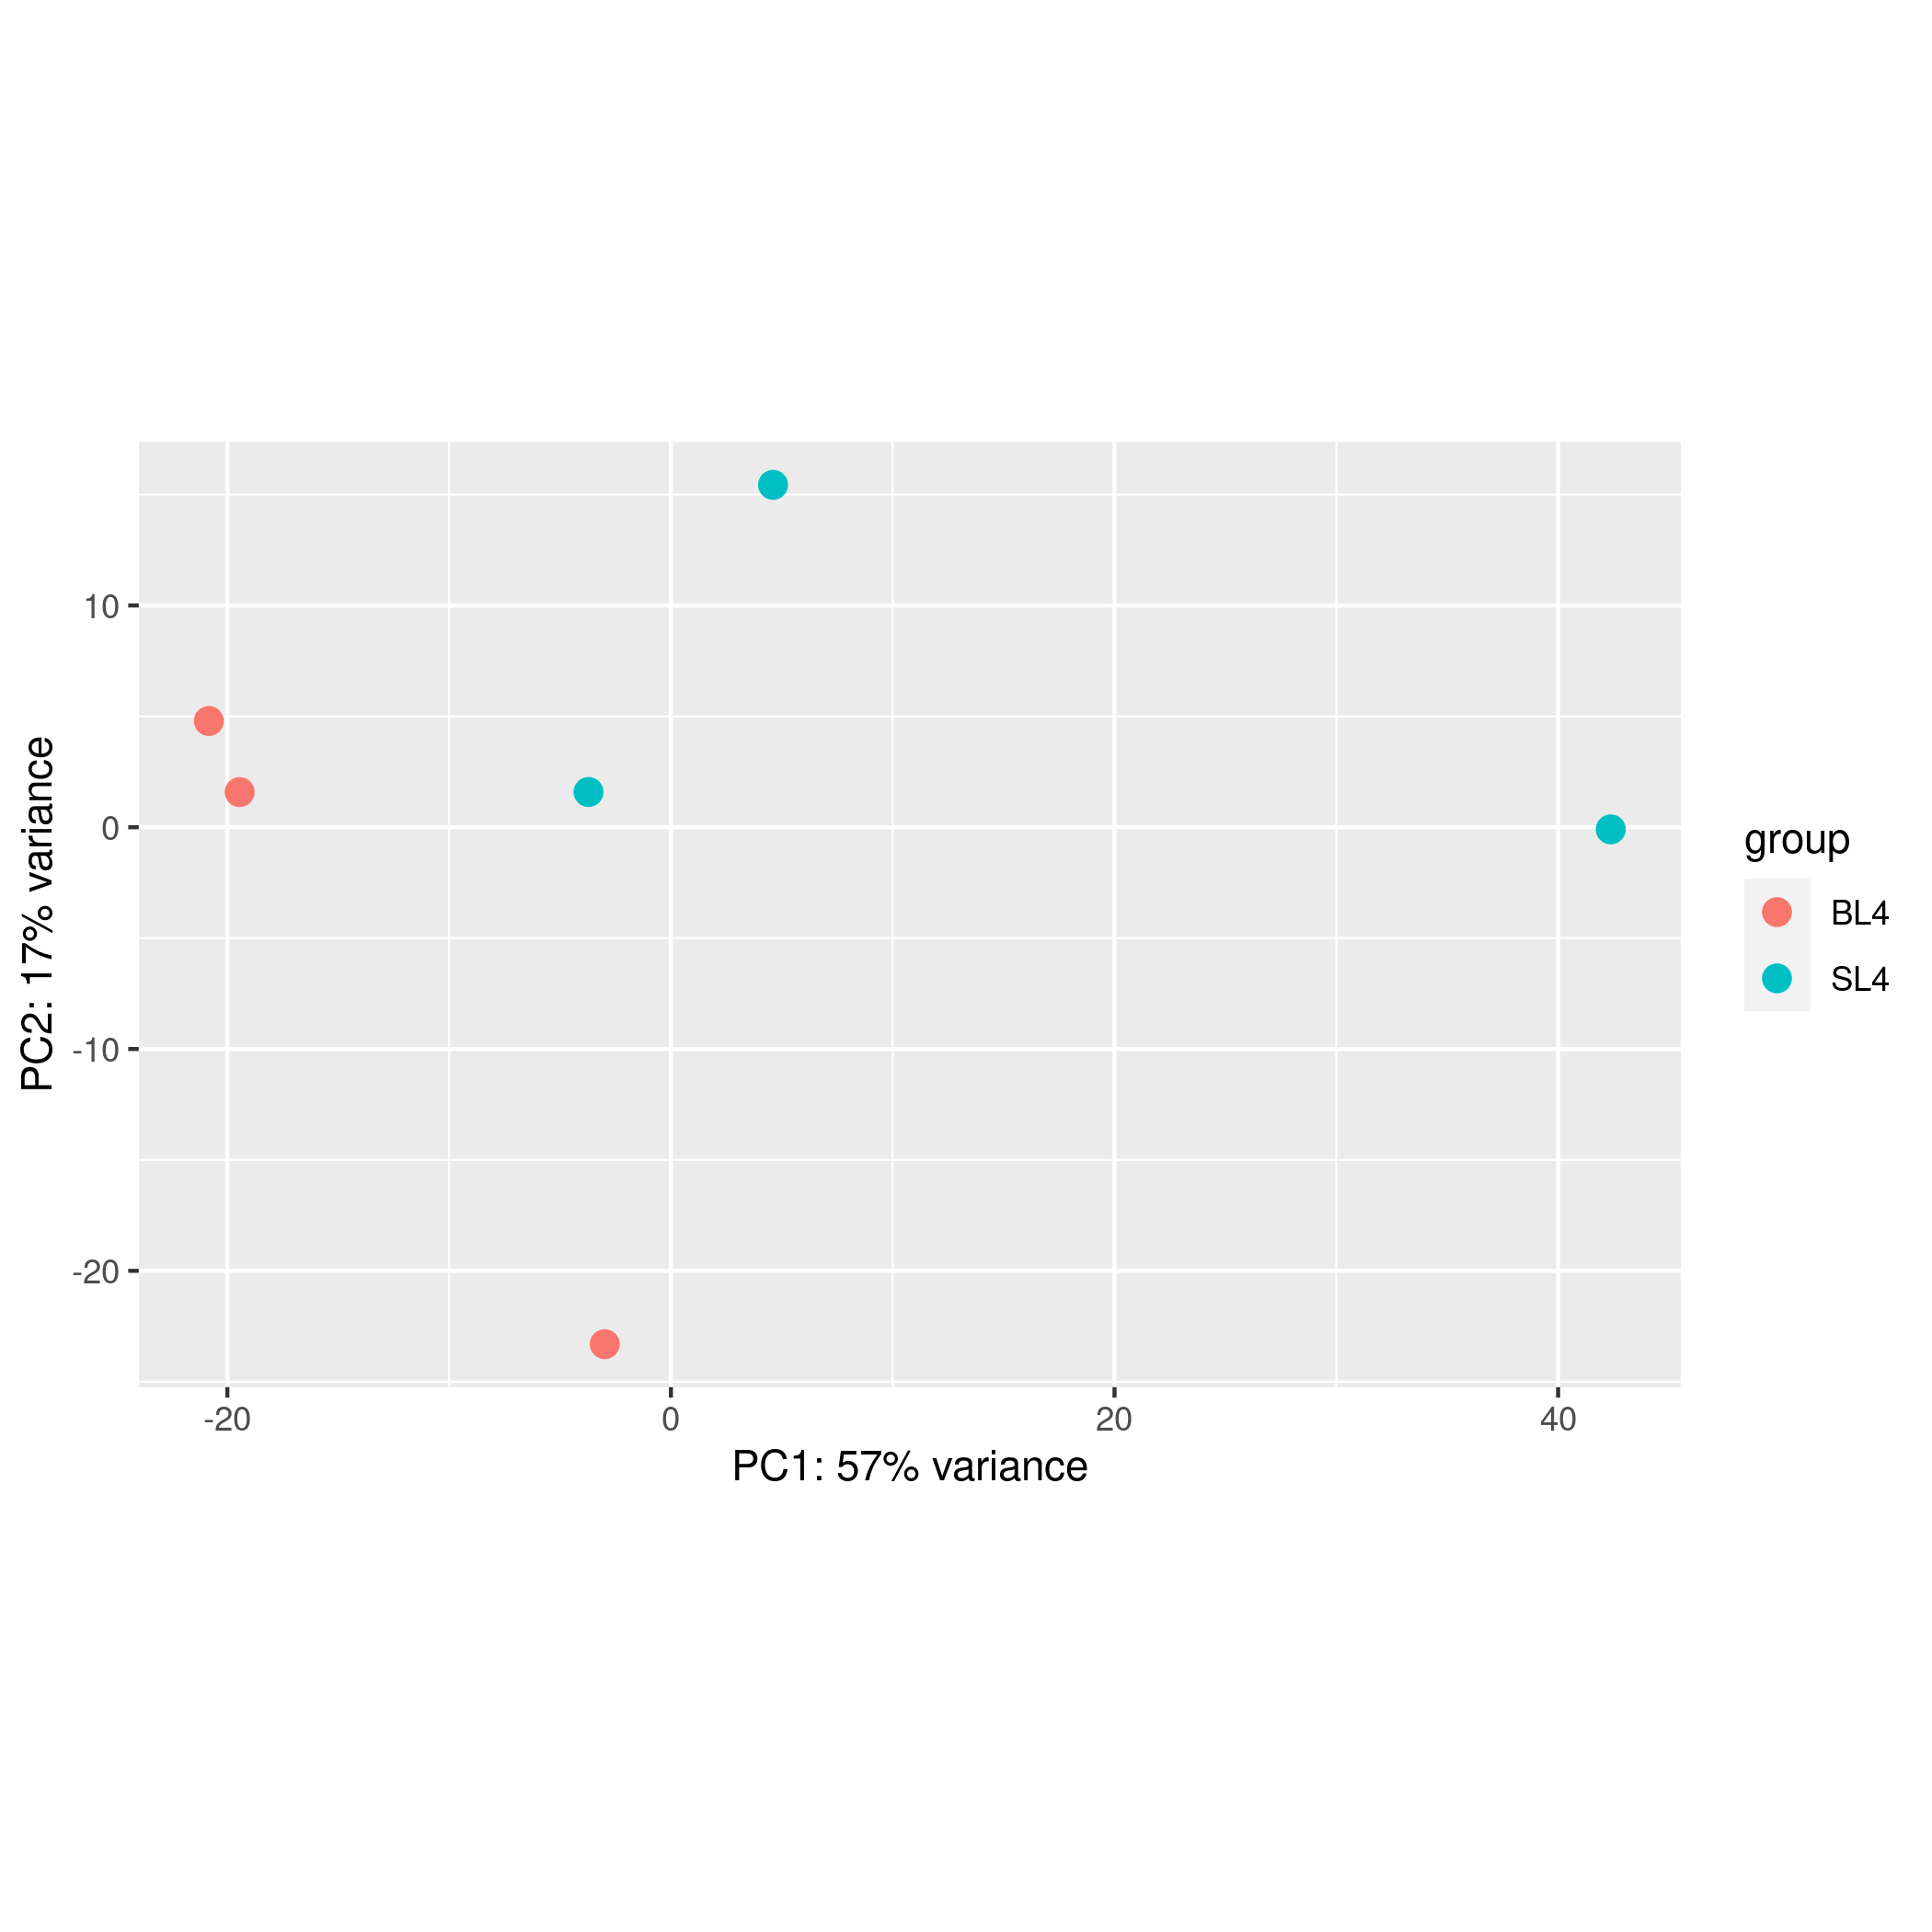
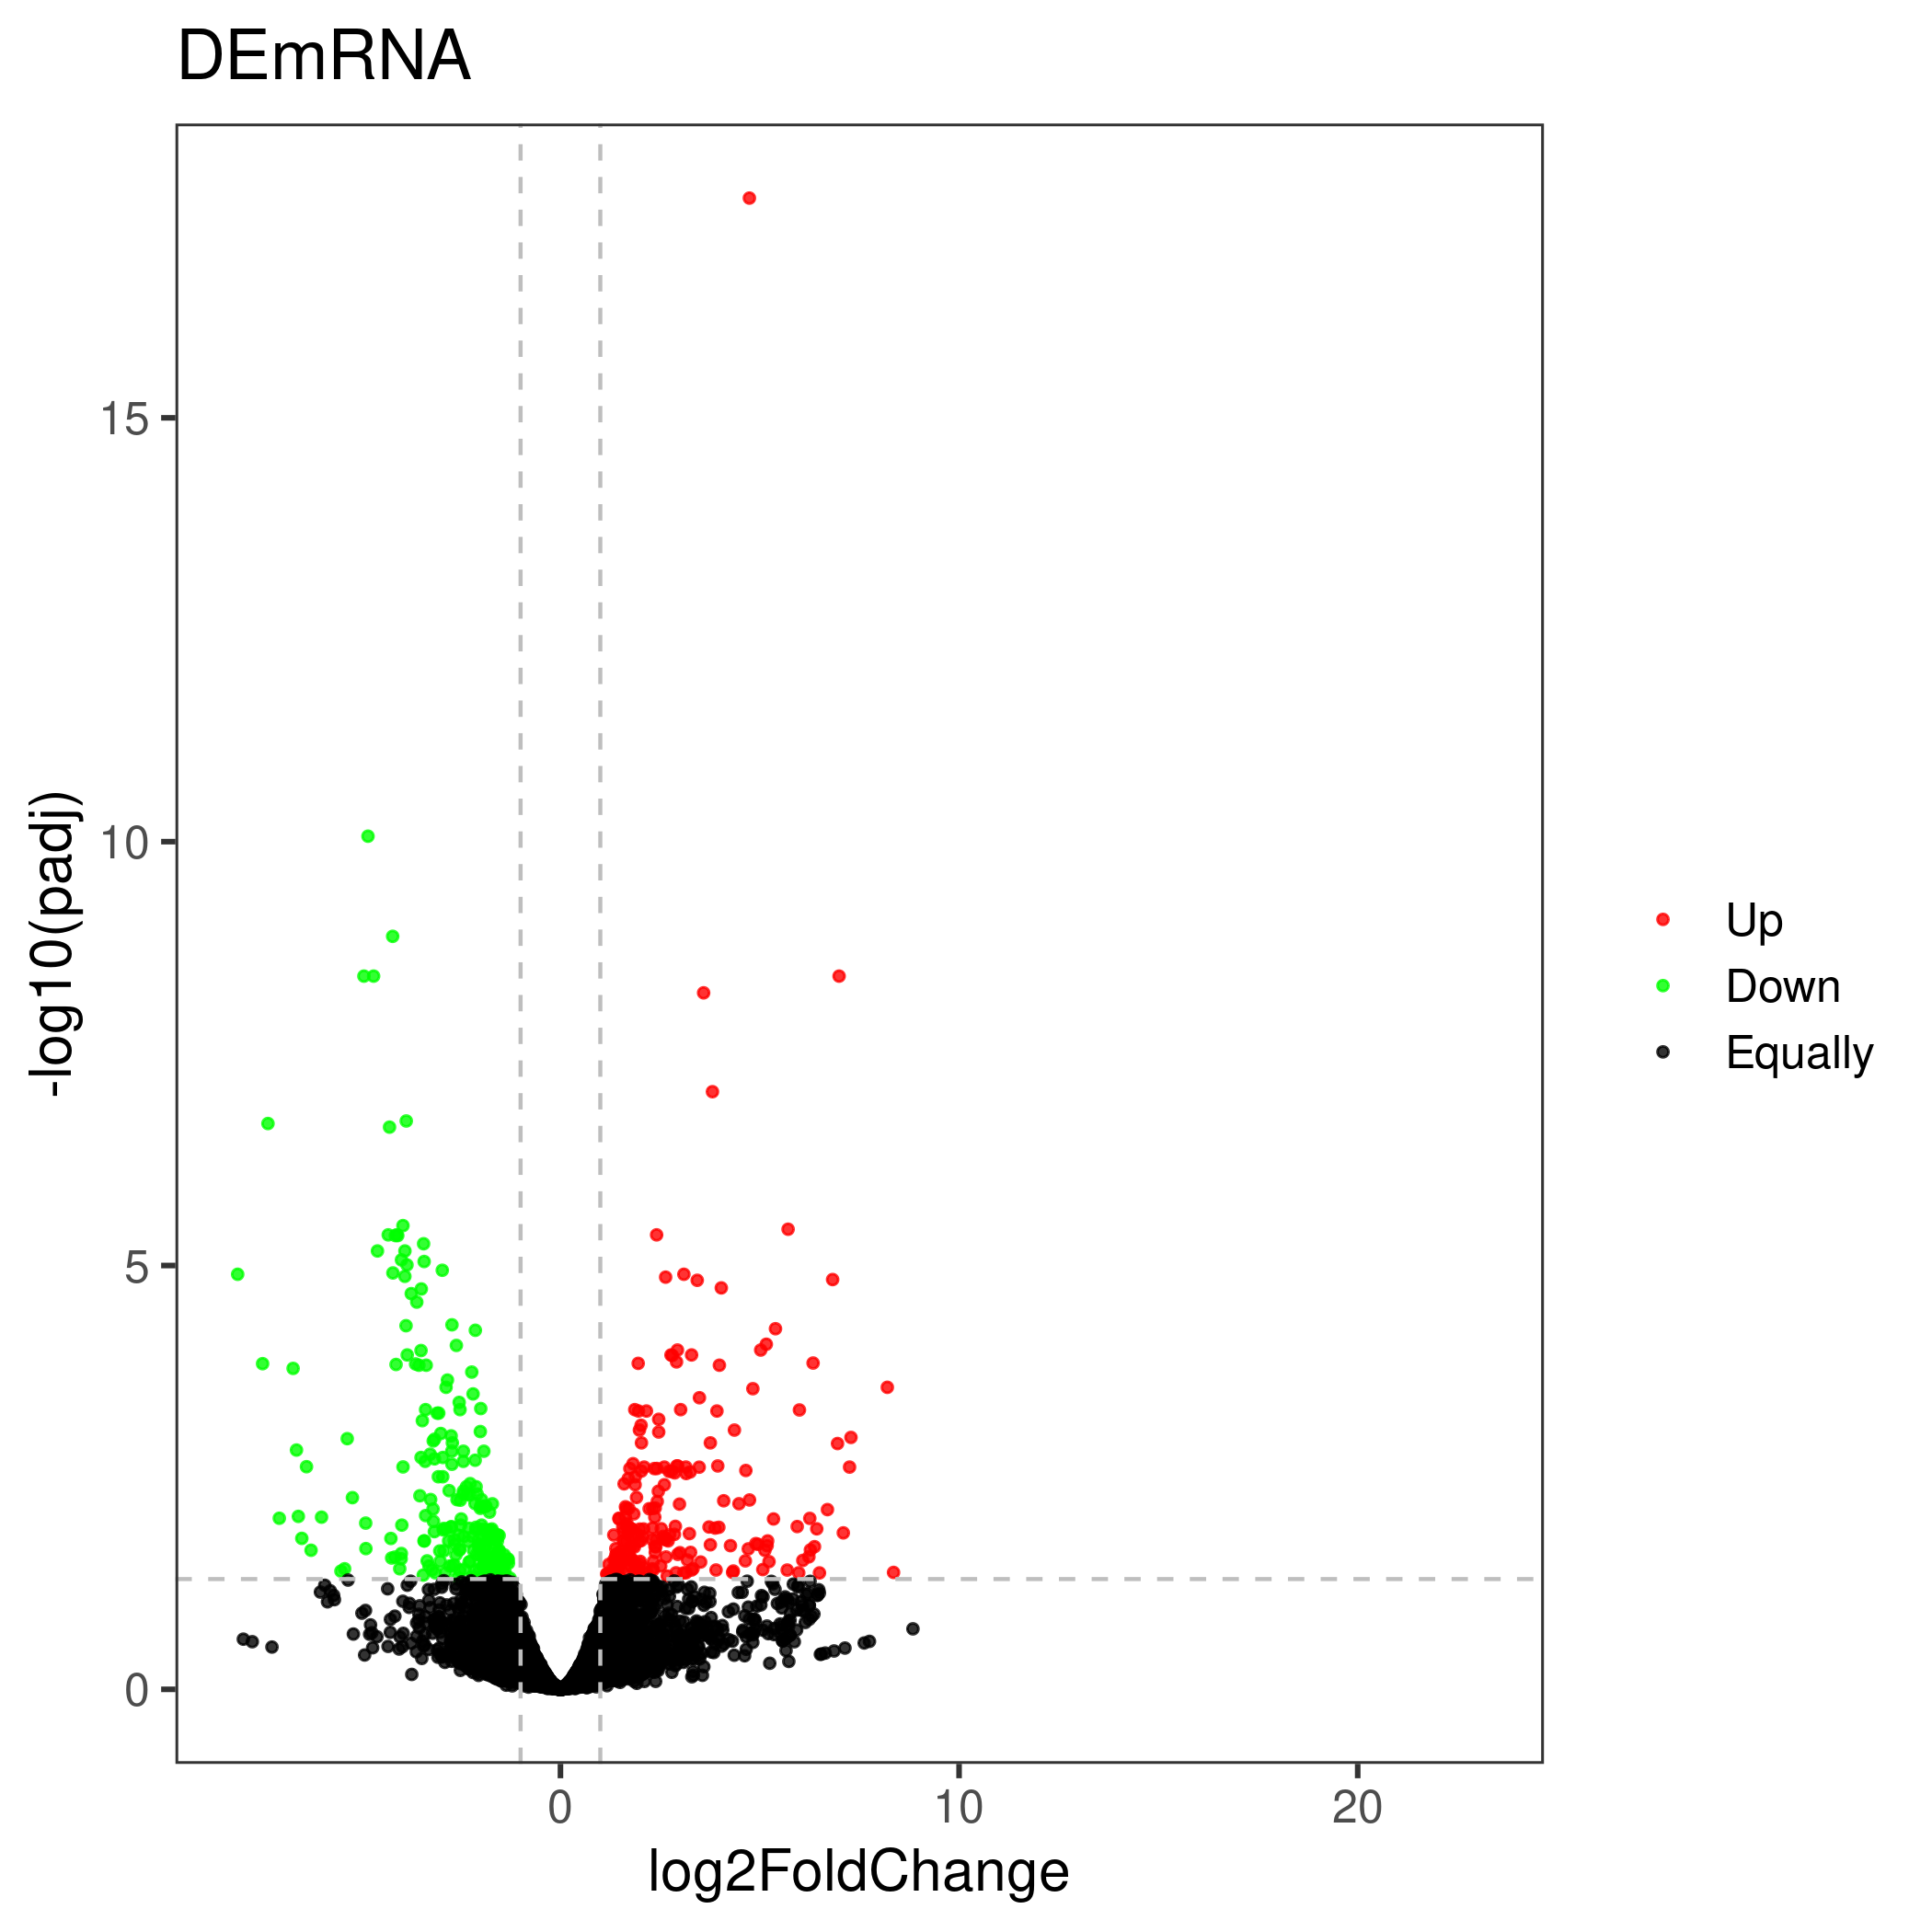
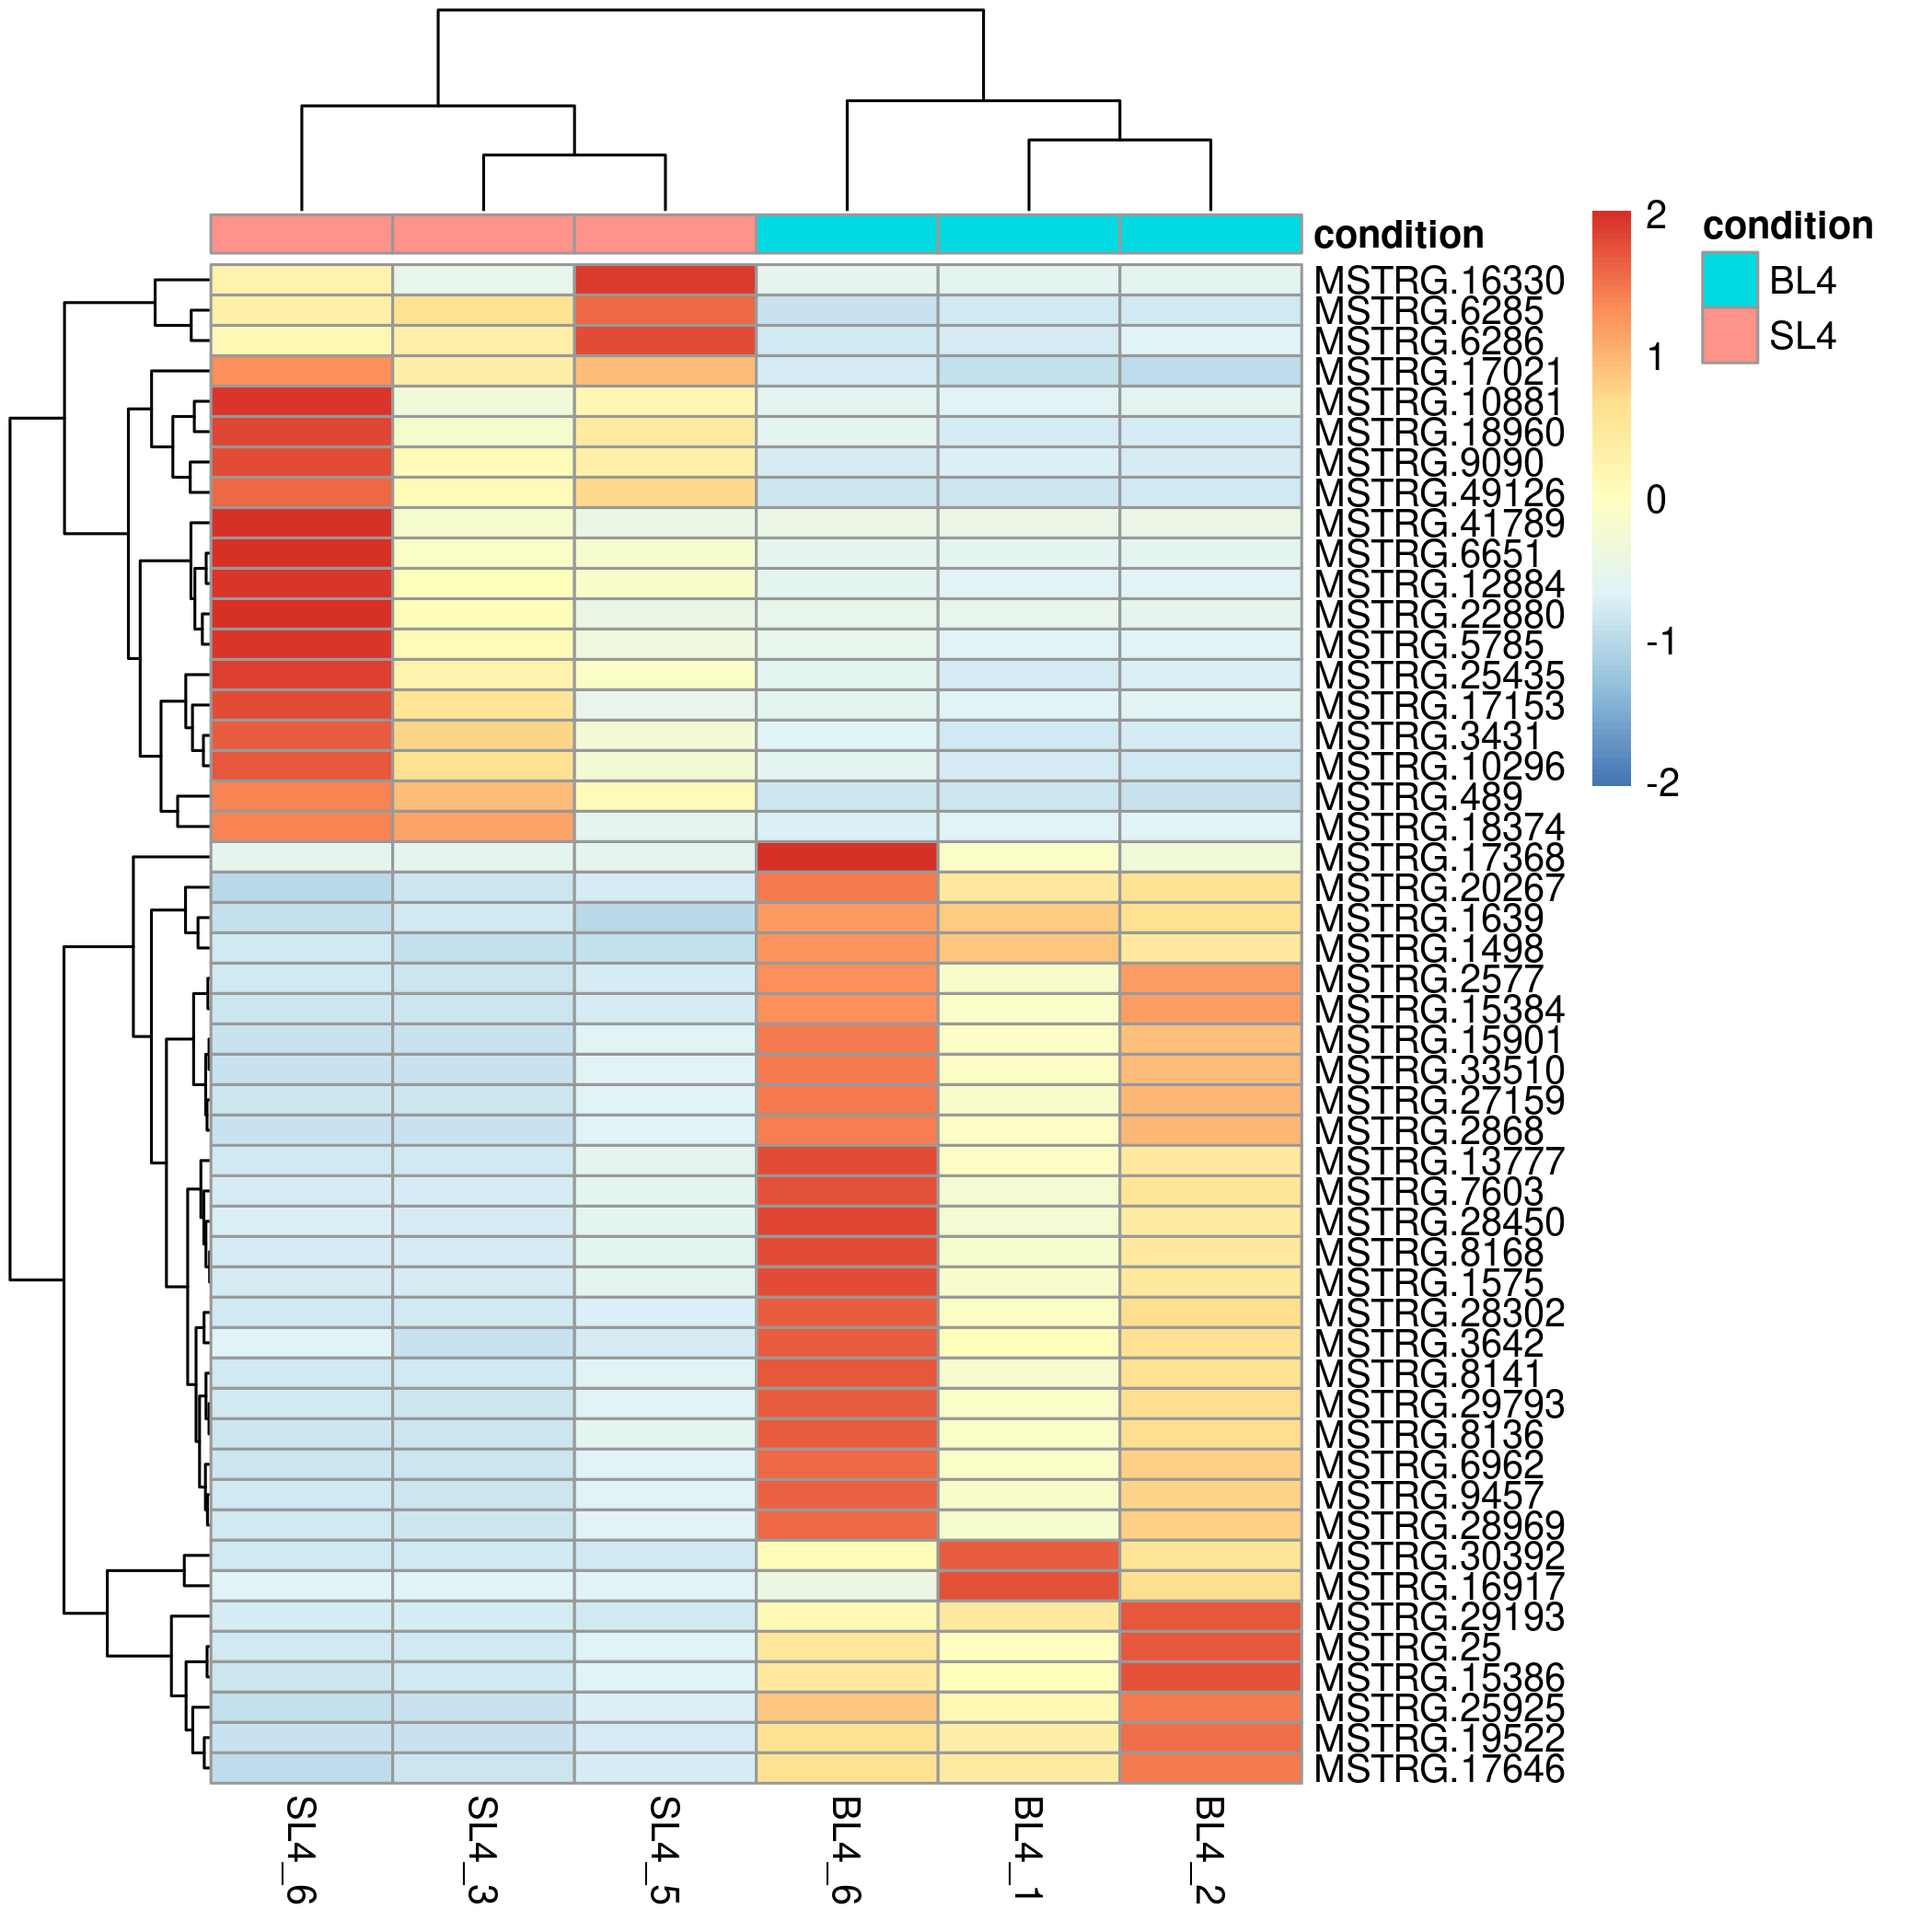
Online differential gene analysis output results include downloadable differential analysis result files and online tables (list of up-regulated and down-regulated genes), as well as online editable visualization images and corresponding ggplot2 object files (as shown on the right), these images include sample pca Analysis visualizations, volcano plots of differential results, and heatmaps of the most significant top x genes all/up/down.
Special attention:
- The core analysis and visual editing functions are provided by Visual Omics. For detailed usage and more analysis functions, please visit http://bioinfo.ihb.ac.cn/visomics.
- The output of the analysis includes an online list of differential genes. Clicking on a line in the list will jump to the detailed information page of the gene in the GitAB database, including transcripts, proteins, annotations, and other detailed information.
Classic Statistical Analysis
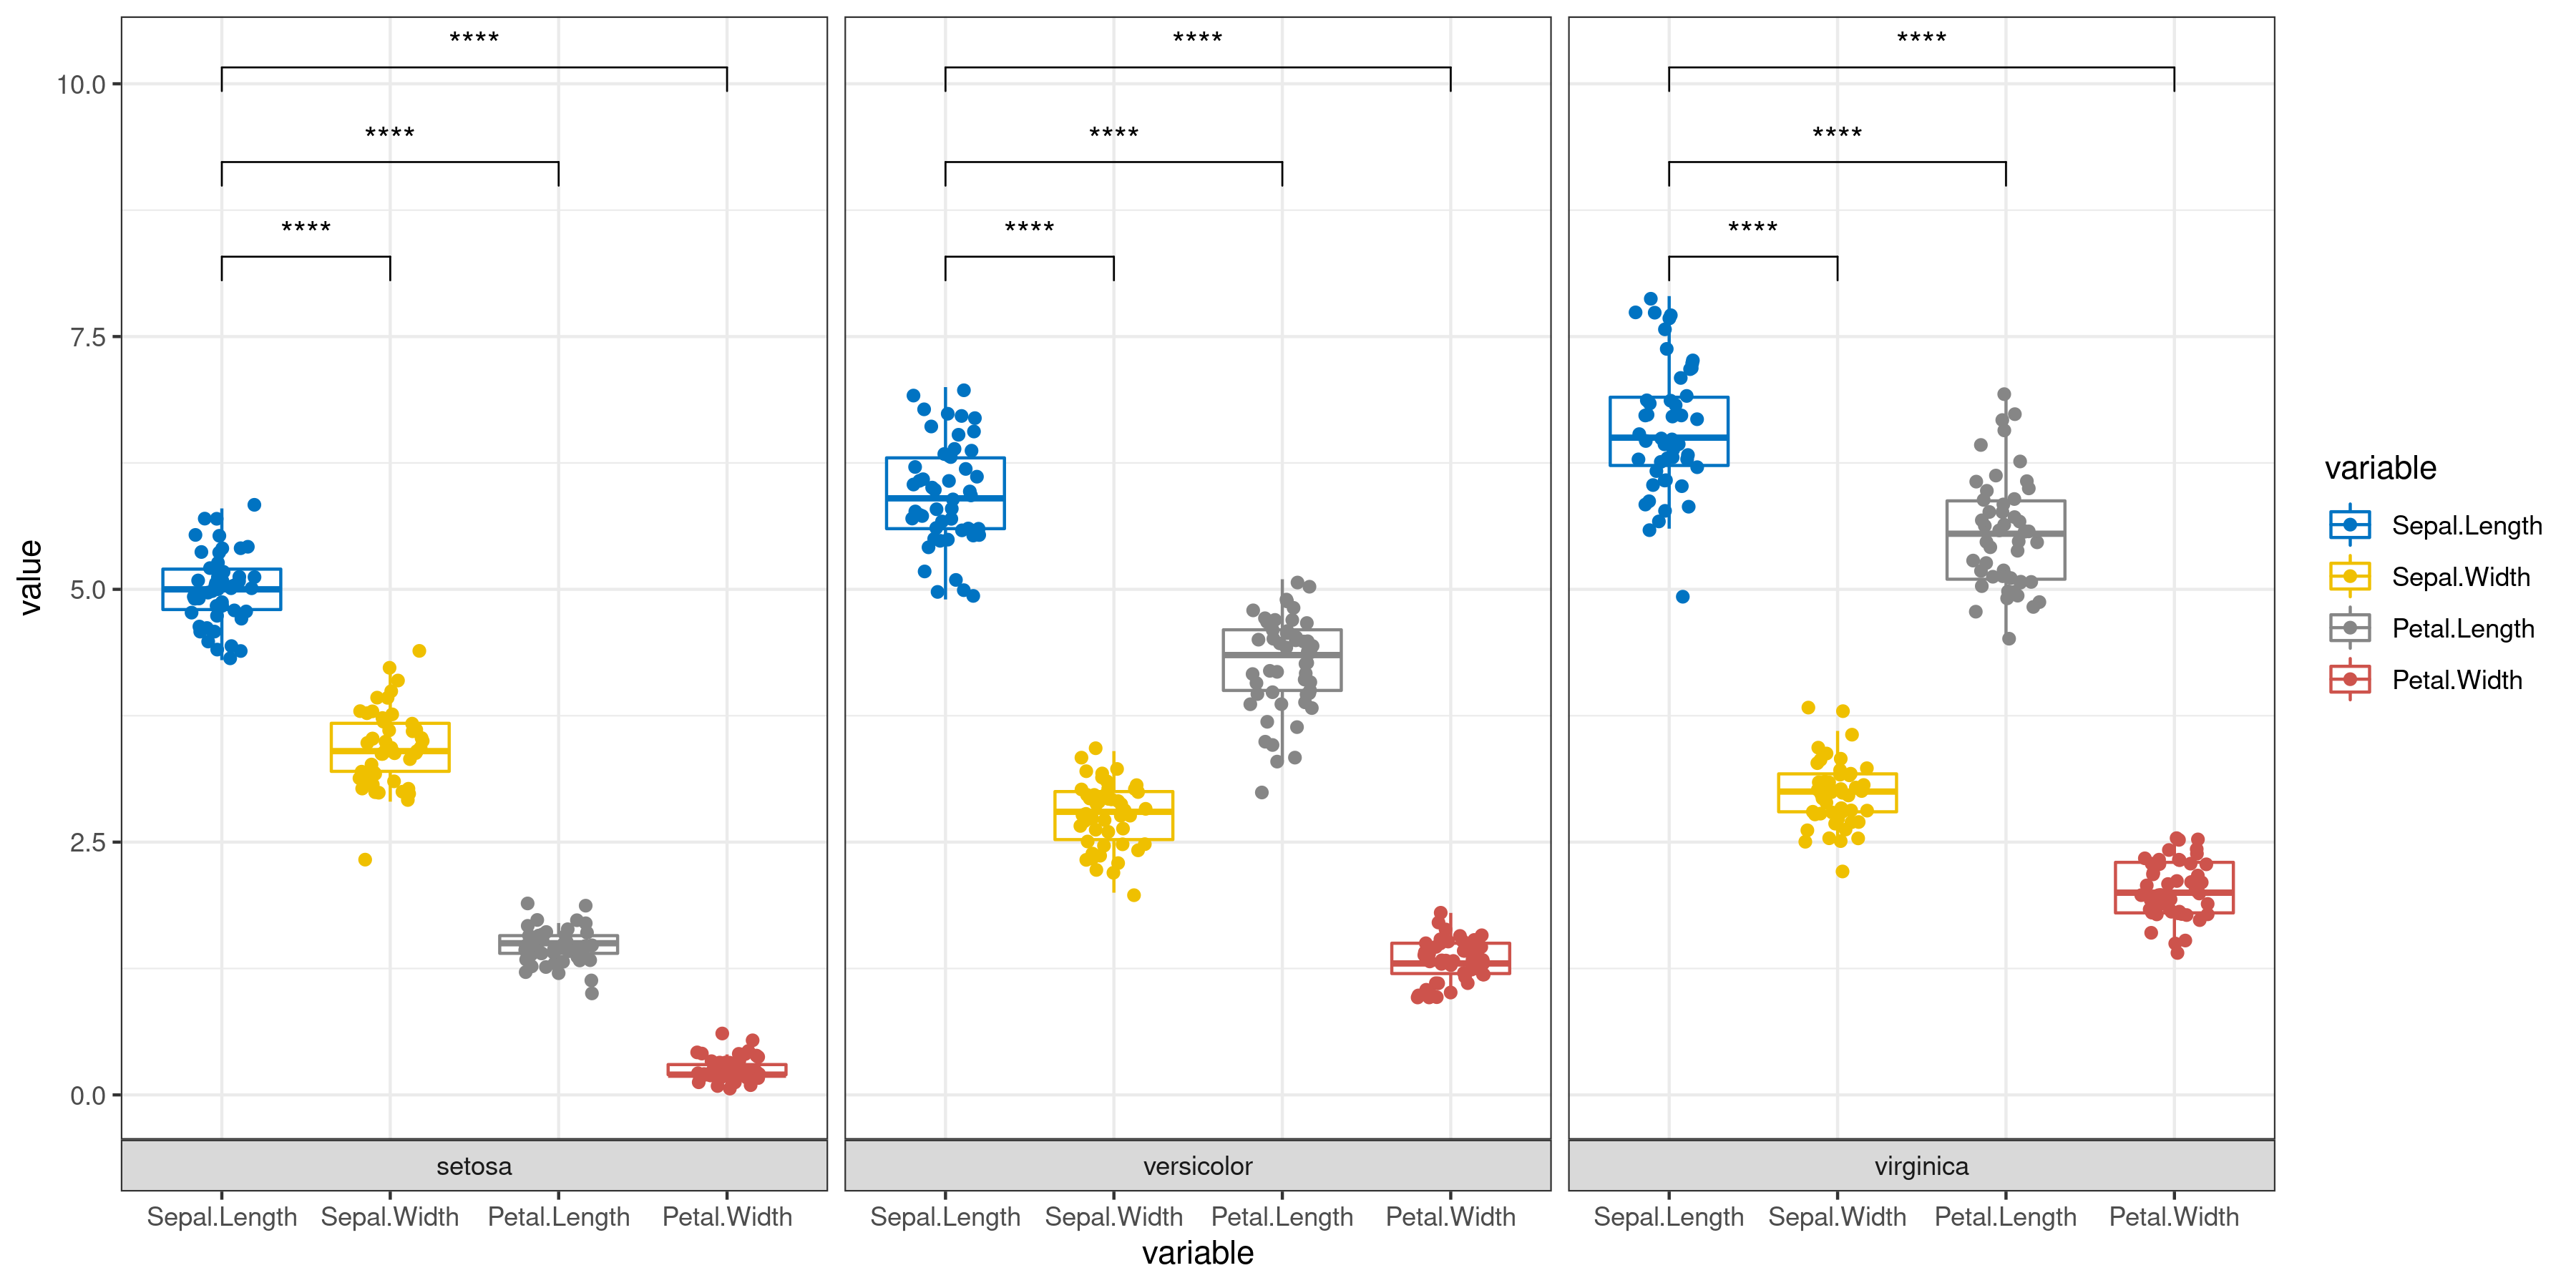
The user only needs to enter the data and simply select whether to add error bars and perform significance analysis to automatically get a graph (bar or box plot) with error bars and significance markers. Of course, the user can also specify which groups are to be subjected to the statistical test from the beginning step by step.
|
1. [ Required ] Paste the file: Note: paste part only support TAB-delimited file as in the example file( Dar graph of mean) or example file( draw bar charts ). It is worth noting that the input file must require column names |
|---|
|
1. [ Required ] : Note: support csv,xls,xlsx ,txt(only separated by tab),not support unicode file! example file( Dar graph of mean) or example file(draw bar charts). It is worth noting that the input file must require column names |
|---|
2. Main parameters:
Data configuration
[ Required ] Group column name:
Bar type:
Subgroup name:
Group mapping colour:
Add err bar:
Add all Significance markers:
- 1: If you want to personalize the add error line, select No and then add it manually inside the detail plot
The p-value is replaced by an asterisk:
Statistical method
The interval between different sets of different labels:
Line size:
Textsize:
Volcano map
The volcano plot uses the difference analysis result file. The user can either specify the up-down marker as a list, or re-limit the log2FoldChange and pvalue to determine the up-down marker.
|
1. [ Required ] Paste the file: Note: paste part only support TAB-delimited file as in the example file. |
|---|
|
1. [ Required ] : Note: support csv,xls,xlsx ,txt(only separated by tab),not support unicode file! example file. It is worth noting that the input file must require column names |
|---|
2. Main parameters:
Use newly specified parameters to determine up-down categories :
Up and down grouping category column namesUp and down grouping category column names
Genes with a significance test p-value less than (padj)
and the absolute value of the fold change greater than (log2FoldChange)
Venn Diagram
Venn diagram parts are visualized using the ggvenn R package. The adjustment of the picture in the fine adjustment part is overlay, pay attention to keep the modification.
|
1. [ Required ] Paste the file: Note: paste part only support TAB-delimited file as in the example file. |
|---|
|
1. [ Required ] : Note: support csv,xls,xlsx ,txt(only separated by tab),not support unicode file! example file. It is worth noting that the input file must require column names |
|---|
2. Main parameters:
Configuration
[ Required ] Group column name:
Show elements:
. Elements sep:
Show percentage:
. Persentage text digits:
garden edge color:
alpha:
size:
linetype:
Set name color:
size:
text color:
size:
Heatmap Drawing
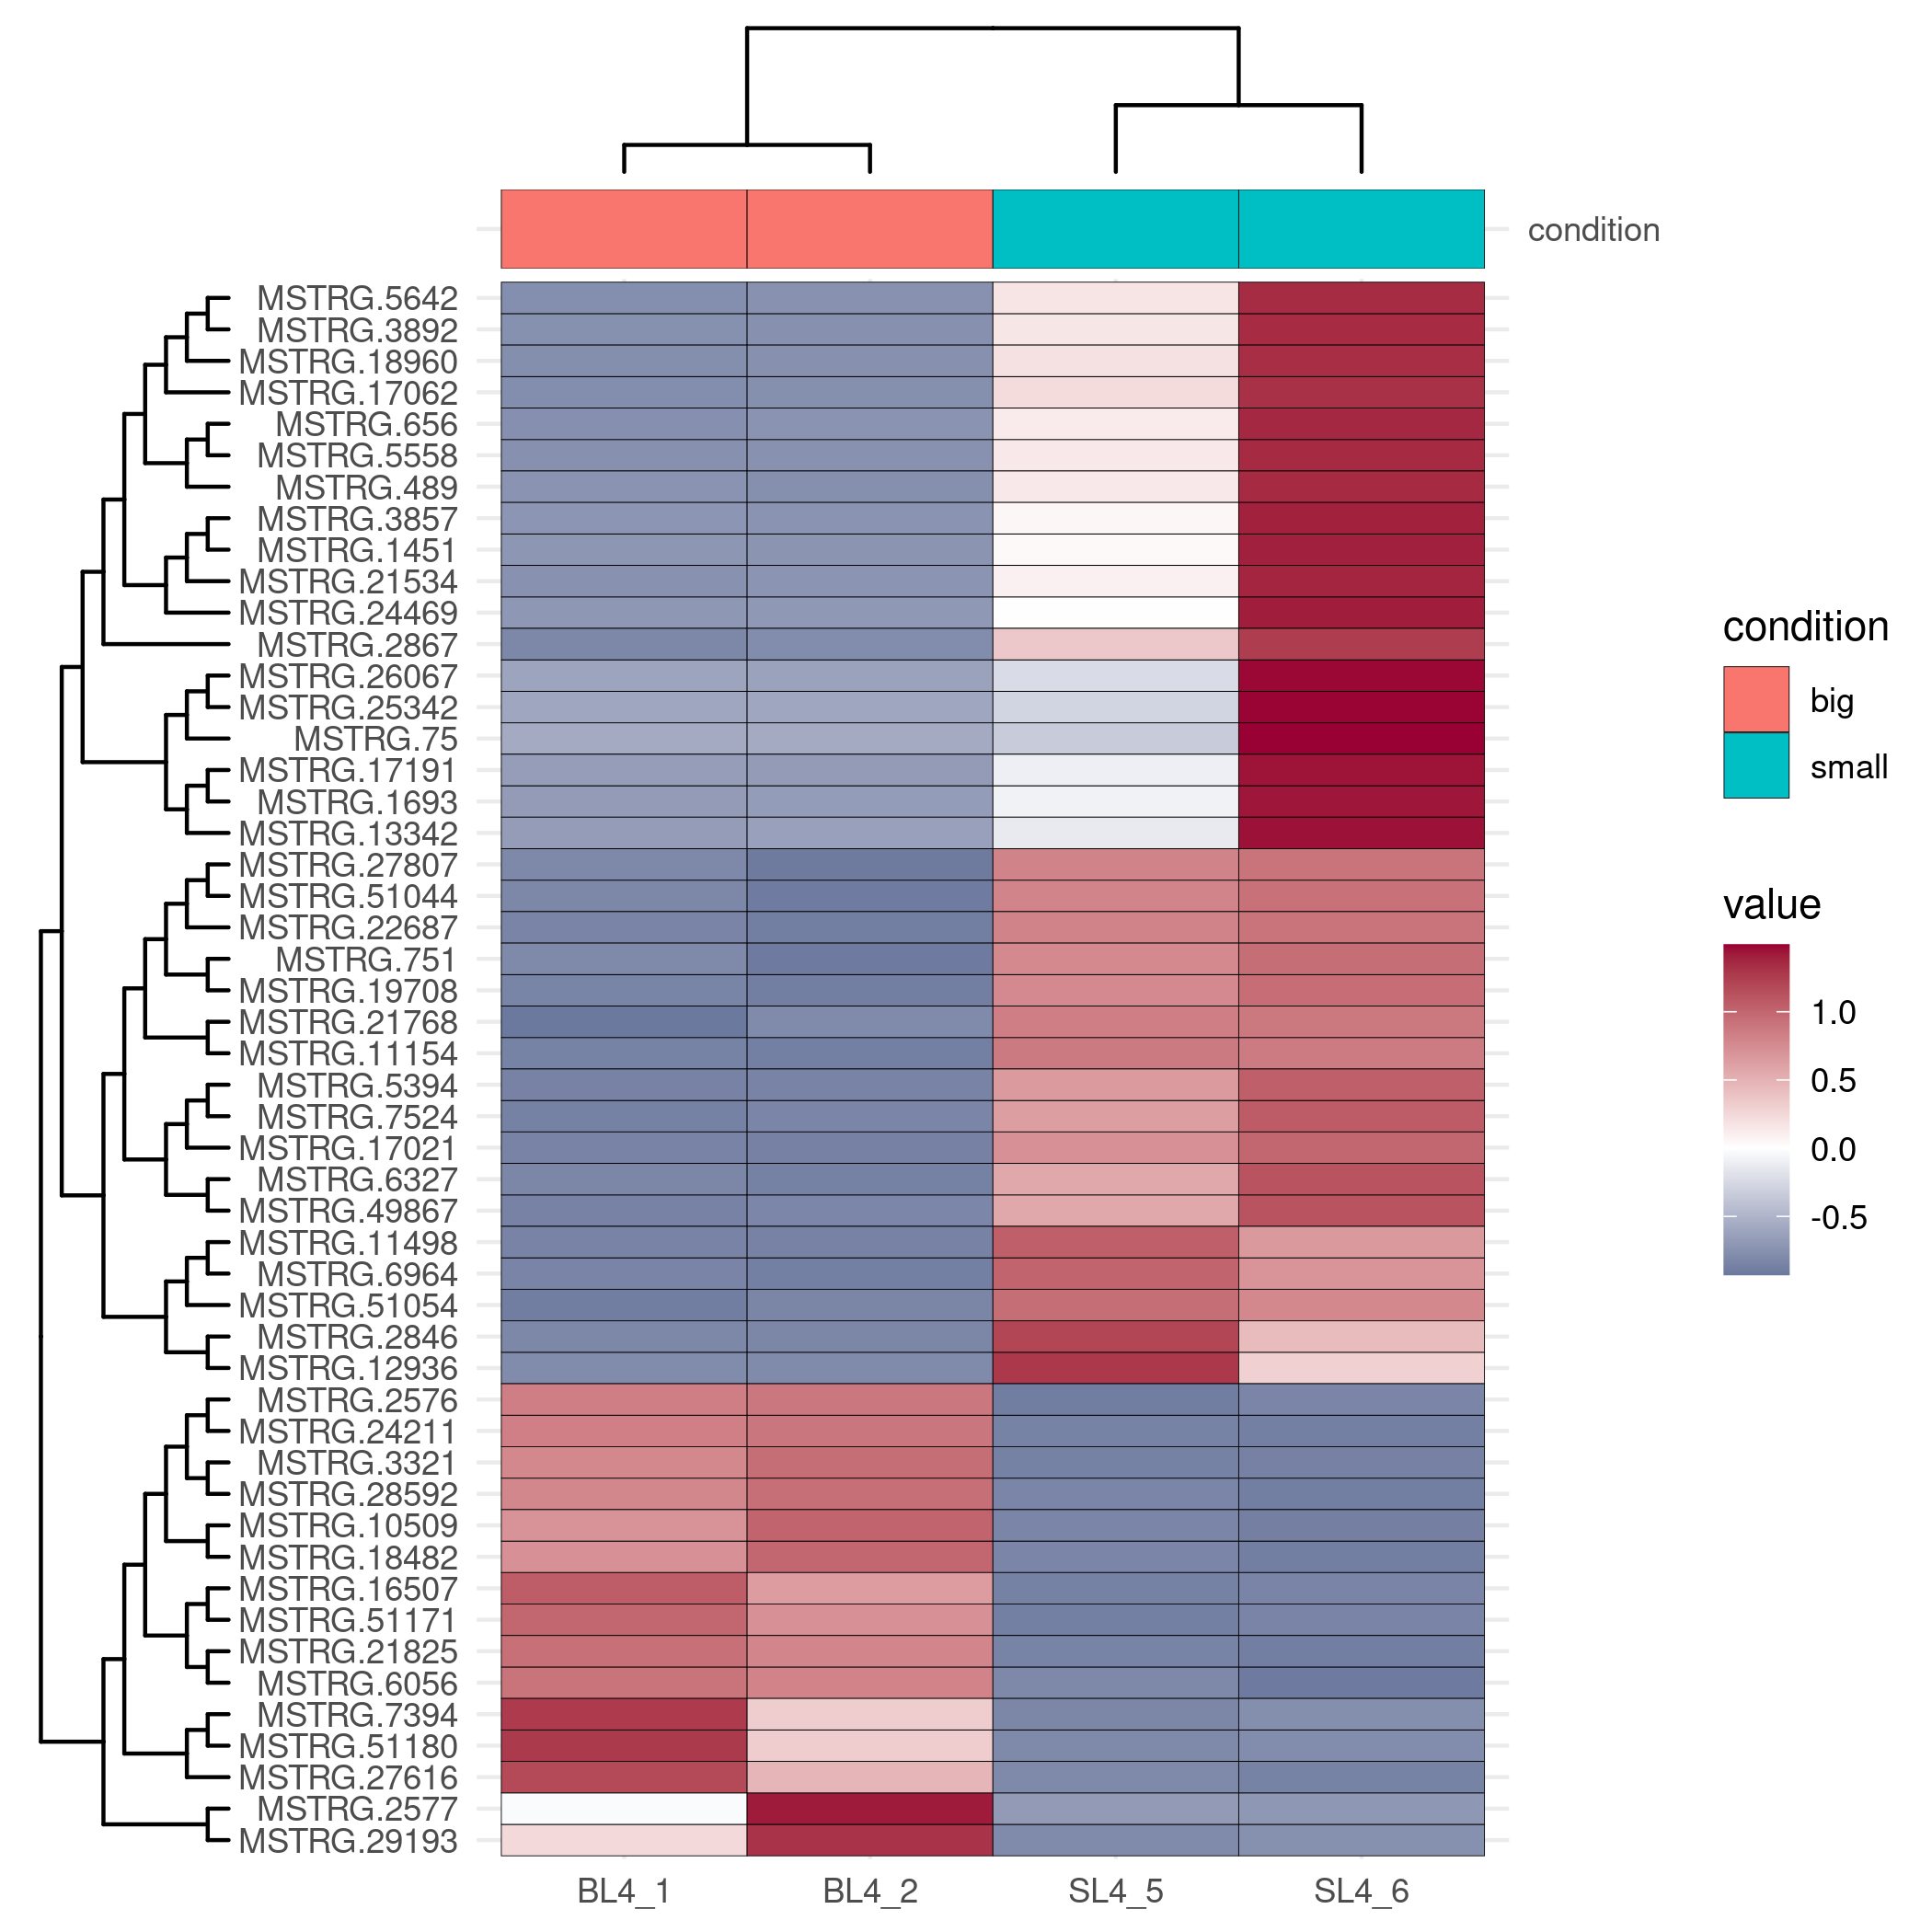
Considering the complexity of heatmap debugging, the visual omics tool provides two drawing methods, one is based on the pheatmap package, and the other is based on the ggplot2 package. The former is simple and beautiful, and the latter can be finely adjusted.
|
1. [ Required ] Upload the file for gene epression information: Note: paste part only support TAB-delimited file as in the example file. |
|---|
|
2. [ Optional ] Upload the file for group information: Note: paste part only support TAB-delimited file as in the example file. |
|
1. [ Required ] Upload the file for gene epression information: Note: only supports csv, xls, xlsx, txt ( TAB-delimited ) as in the example file, and does not support unicode type files. |
|---|
|
2. [ Optional ] Upload the file for group information: Note: only supports csv, xls, xlsx, txt ( TAB-delimited ) as in the example file, and does not support unicode type files. |
3. Main parameters:
Choose different plot methods:
Add sample group:
Data transform:
Add hclust on sample and gene:
Hclust two important parameter:
Show group legend:
Show number:
Picture title:
Text angle:
TextSize:
0
Error report
input expression file : expression data
group file : group data
- Get in touch
- Li Heng, Email: liheng19@mails.ucas.ac.cn
- copyright 2021-2022
- @Institute of Hydrobiology, Chinese Academy of Sciences Lab of bioinfomation


