Scientific Scenario
Base Plots
Retuning Plots
Help
- © 2022-2023. All rights reserved
- Note: Visual Omics will be updated at 2023/10/1 12:00 ~2023/10/2 12:00 (equivalent to 2023/10/1 00:00~2023/10/2 00:00 US time). The tool will be temporarily suspended at that time.
Update: 1. At present, the R version and the main analysis R package have all been updated, R=4.2.2, clusterProfiler=4.6.2, etc. KEGG enrichment analysis function has returned to normal. If there is any abnormality in the function after this version update, please contact the author in time
2. the function of id conversion has been changed from AnnotationHub:: mapIds to clusterProfiler::bitr support, and the annotation packages of all model species have been updated.
3. The score has been partially revised in the Protein Interaction Prediction_ Threshold failed to work bug, fixed id mapping error
4. We added the eigenvalue correction parameter for ordinations, if the correction is selected but no correction occurs (Euclidean distance), the uncorrected eigenvalue is still used.
5. Enrichment analysis of 29 fish species is newly supported
Multiple Omic's analysis
The online tool Visual Omics integrates various free analysis processes including DE analysis, Enrichment analysis, protein interaction prediction, protein domain prediction,traditional statistical tests, omics analysis single analysis.
Image Modification
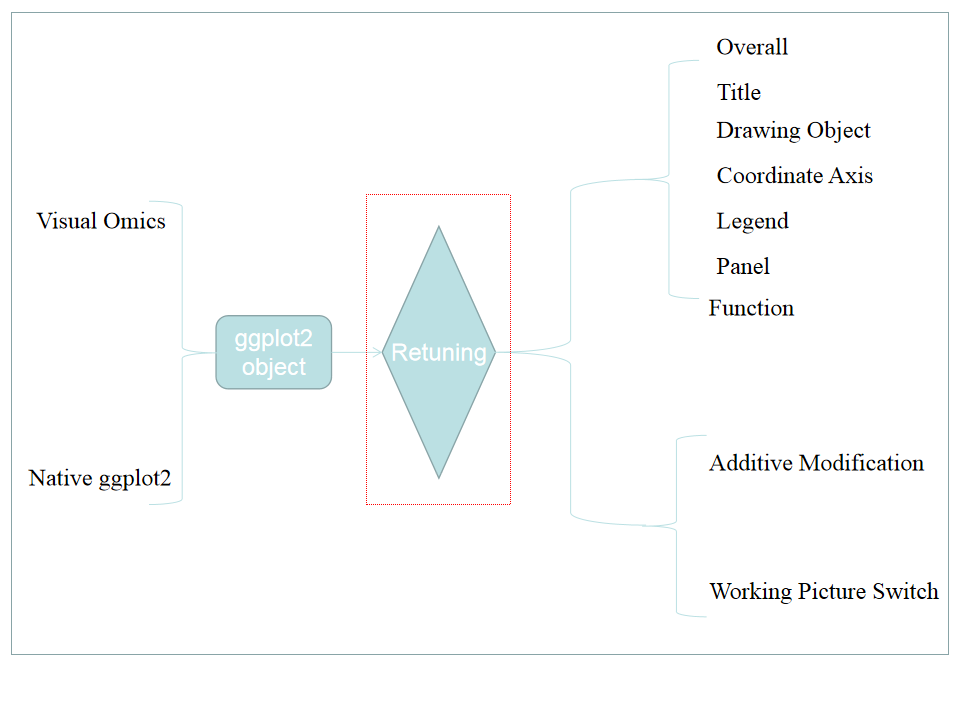
The online image modification function mainly relies on the R package ggplot2 and its series of R packages. The main 38 elements and 21 functions in ggplot2 are selected, with a total of 262 parameters. The main features are additive modification and working picture switching.
The adjustment panel will be automatically cleared When the user switches between different types of pictures for fine adjustment:
The adjustment panel will be automatically cleared When the fine-tuning button is clicked each time:
Contact
Xia,Xiao-Qin,PhD xqxia@ihb.ac.cn
Citation
Heng Li, Mijuan Shi, Keyi Ren, Lei Zhang, Weidong Ye, Wanting Zhang, Yingyin Cheng, Xiao-Qin Xia, Visual Omics: A web-based platform for omics data analysis and visualization with rich graph-tuning capabilities, Bioinformatics, 2022;, btac777, https://doi.org/10.1093/bioinformatics/btac777
Back to Home
Link help: a: Click this icon to return to the home page on any page b: Click the icon in this part to jump to the introduction page of our laboratory.
Basic operation
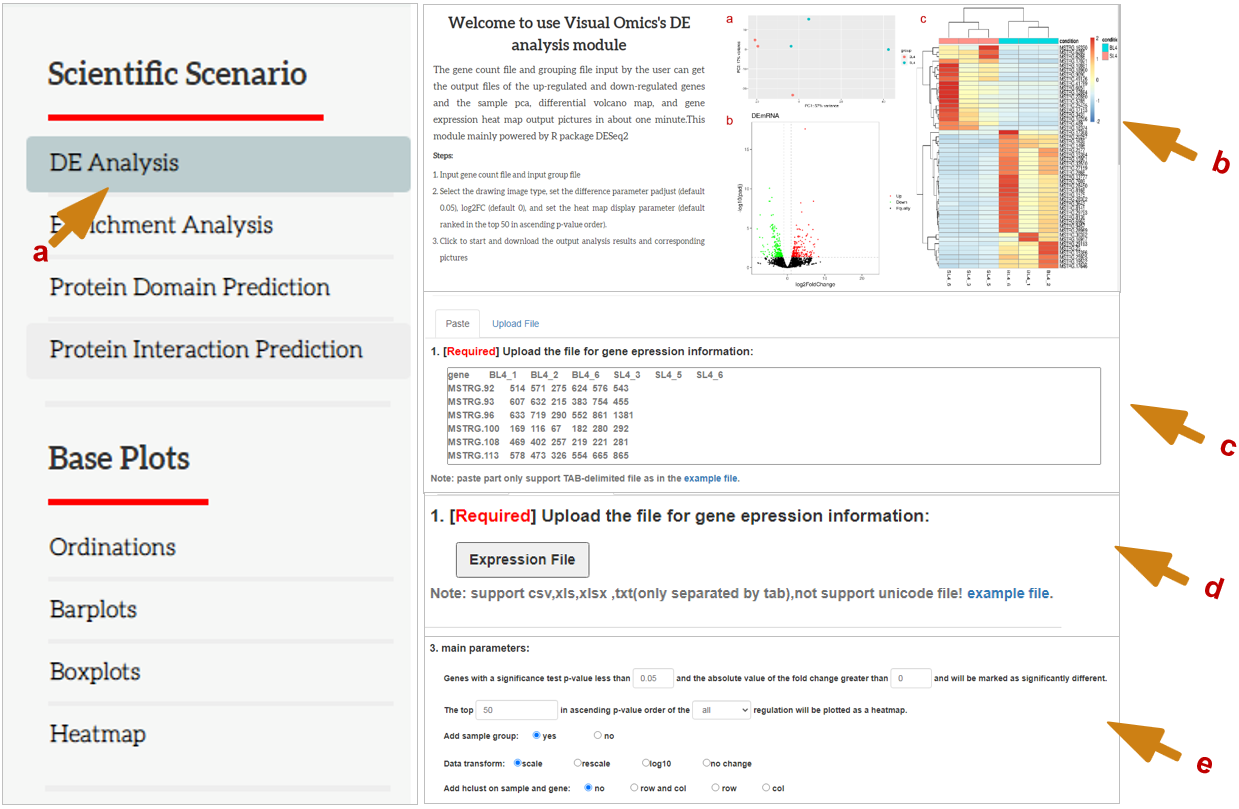
Basic operation: a: you need to select the type of picture you need to draw or analyze. Click (a) which means you have selected this drawing or analysis method. b: shows the principle of the analysis selected by the user, the operation steps and the main output picture. c and d: c shows that the user can upload data by copying the data (tab-splitting) and pasting it. d shows that users can upload data by uploading files. e: The main parameter part of the analysis plot is displayed, and the required part in red is the option that must be set.
Fine tuning parameters
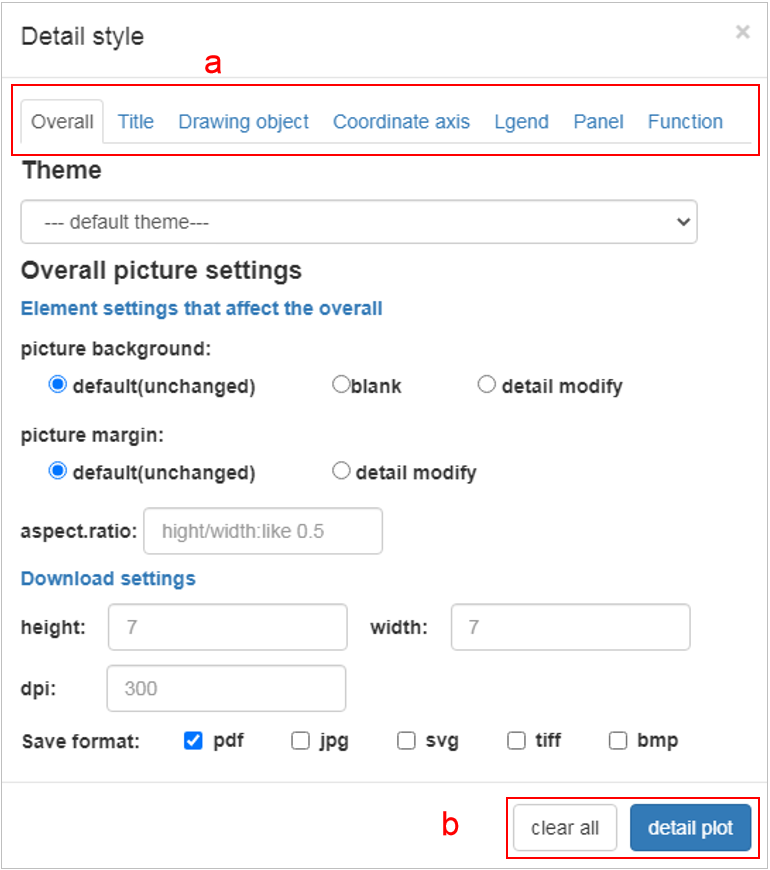
Fine tuning parameters: All parameters are divided into seven parts as shown in a. Overall: Represents the overall parameters of the image such as image format, resolution, etc. Title: Represents the title settings of the most commonly used pictures, including the main title, subtitle, lower right/upper left title, x/y axis title and legend title. Drawing object: Represents the properties of the picture drawing object, that is, the data is mapped to color, size, padding, etc. Coordinate axis: style: All settings of the x/y axis except the title include the styles of the axis, labels, etc., as well as the property settings for the x/y axis of the data. content: For continuous and discrete designs, including data transformation, location, label reset (breaks, labels). Legend: The style setting parameter part of the legend. Panel: This part mainly sets the panel style, you can cancel the auxiliary line, change the panel color, etc. in this part. Function: This part integrates some functions, including adding image element name, adding text on the image, enlarging the image, reversing the coordinates and other functions. After setting the parameters, click the detail plot in part b to modify the picture. By default, the results of each modification will not be cleared. If you want to clear all previous options, please click the clear all button in part b.
Fine tuning behavior
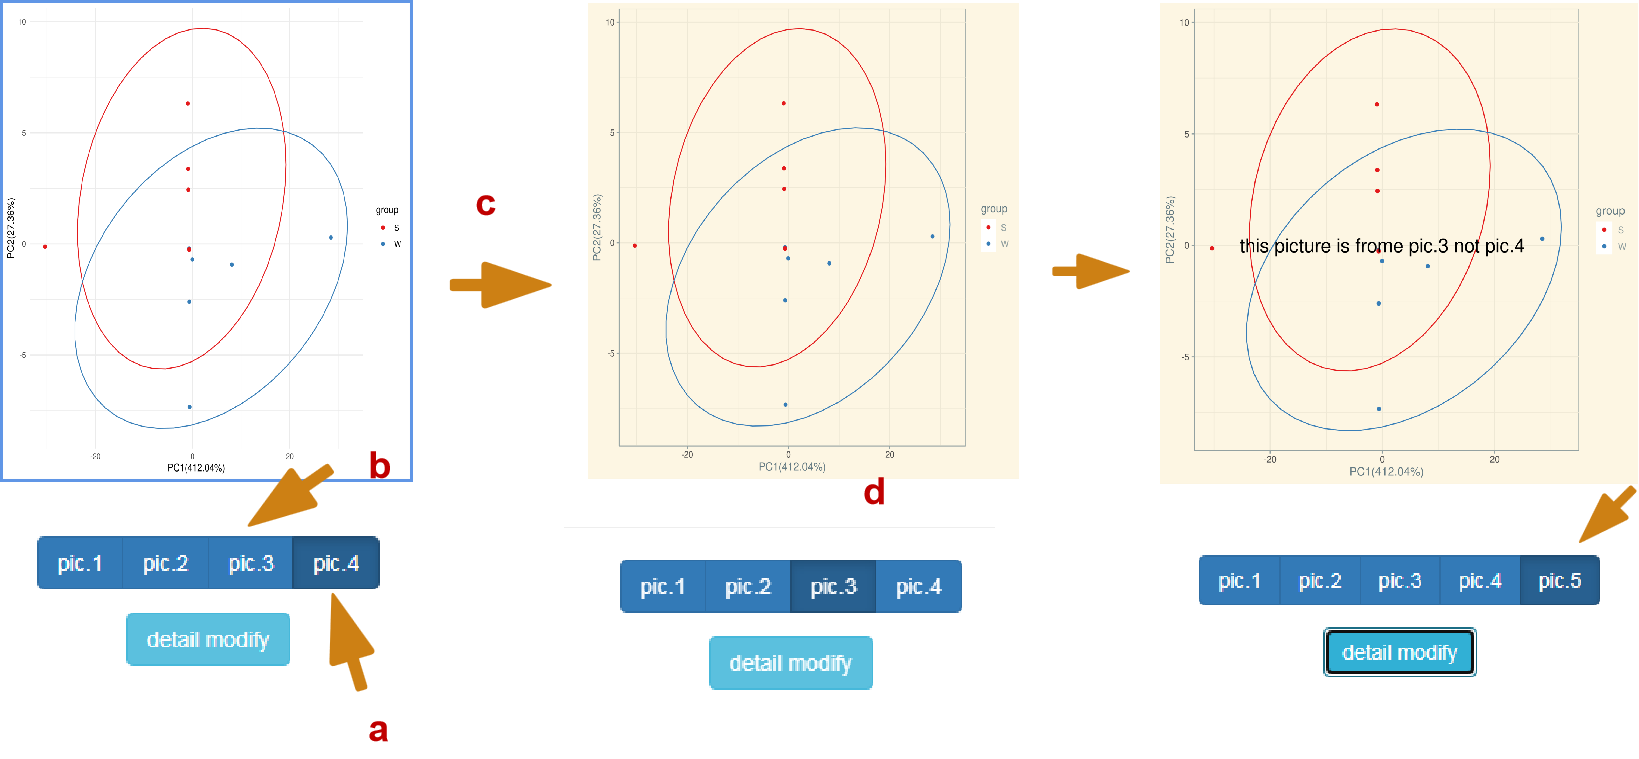
Fine tuning behavior: each time you click detail modify, you will submit once, as shown in A. at present, the user has submitted to PIC4. At this time, click pic. 3, as shown in B, and you will jump to pic. 3 to submit the picture, as shown in C. Any modification at this time is based on PIC. 3. As shown in pic. 5, the figure is actually modified from pic. 3 rather than PIC4. If you find that you still haven't added after switching, it should be that the content of your selection panel is not clear and clean.
Error report
Err report:If you find a bug, please inform the author of the error in time and declare again that this version is a test version and should have many bugs. If you find anything abnormal in the process of use, please be sure to feed back the error information to me. I will be very grateful. When you feed back the error, you need to click the place shown in the figure to feed back the err report screenshot and the error to me.
Download
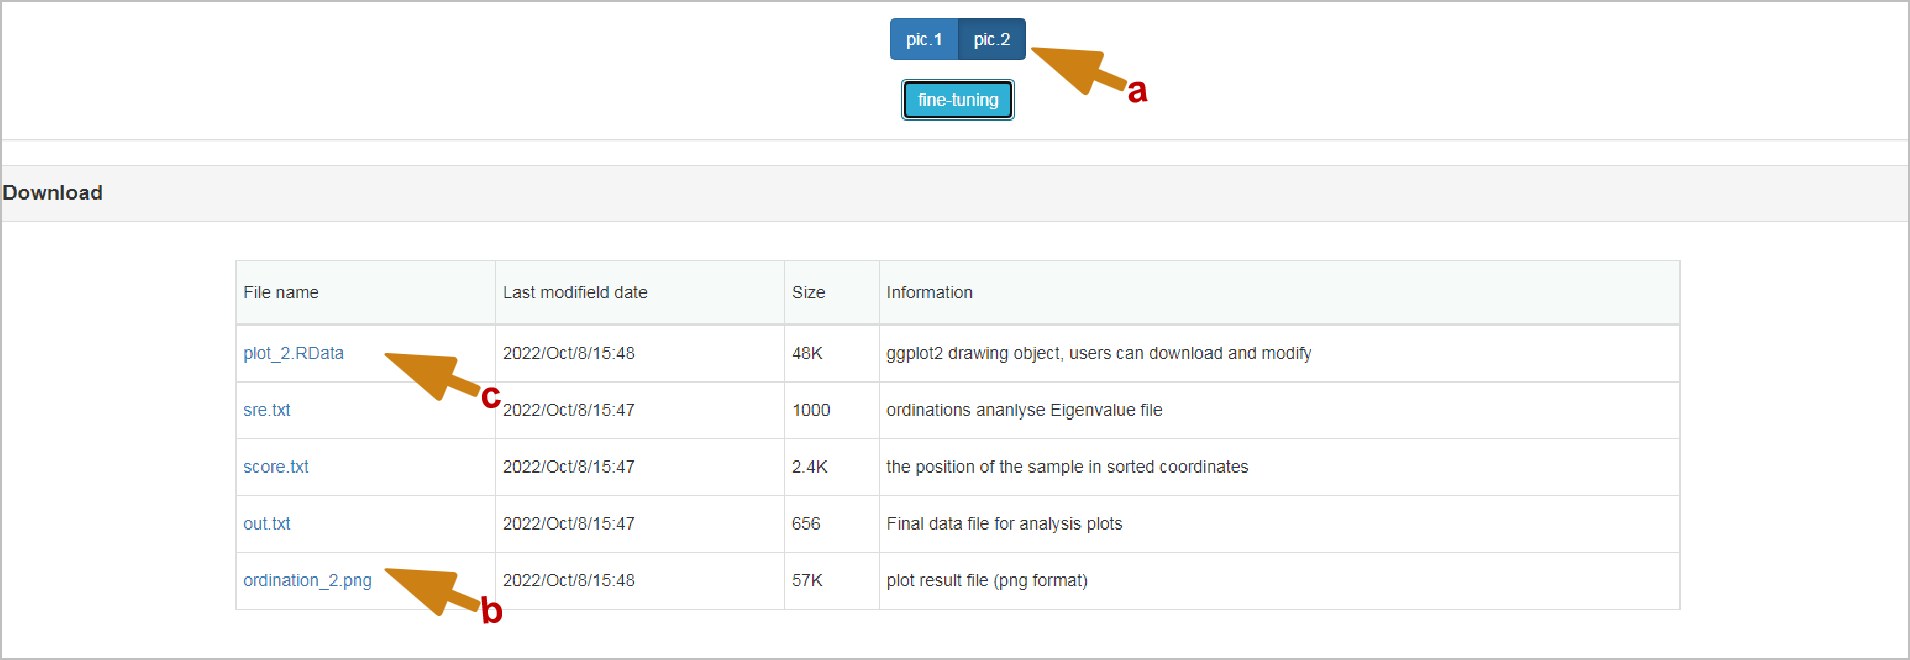
Download: Pictures in any format are based on orders_ It's named in the form of number (b). It's worth mentioning that the content of downloaded files will be switched with the switching when the switching is different (a). Except for the pictures, all the intermediate results of the analysis are given in TXT format. The file at the end of .RData is the R native object (c), which may be helpful to you. Or download the .RData file and input it into the Retuning Plots section to modify the style on the corresponding image.
Retuning Plots
Retuning Plots: Currently the input only supports Visual Omics and drawing objects generated by native ggplot2. Native ggplot2 objects require the user to select the correct image properties. The currently included mapping objects include discrete/continuous color, discrete/continuous fill, and continuous/discrete point size. In addition to these, you also need to set the X/Y axis data attributes of the image. How to generate ggplot2 objects myself ?> 1. var_p <- ggplot(....) 2. save(var_p, file="XXX.RData"). Note that in order to prevent the system from maliciously loading some RData, we will check the RData file input by the user, if there is any discrepancy The specified ggplot2 object exists, an error will be reported
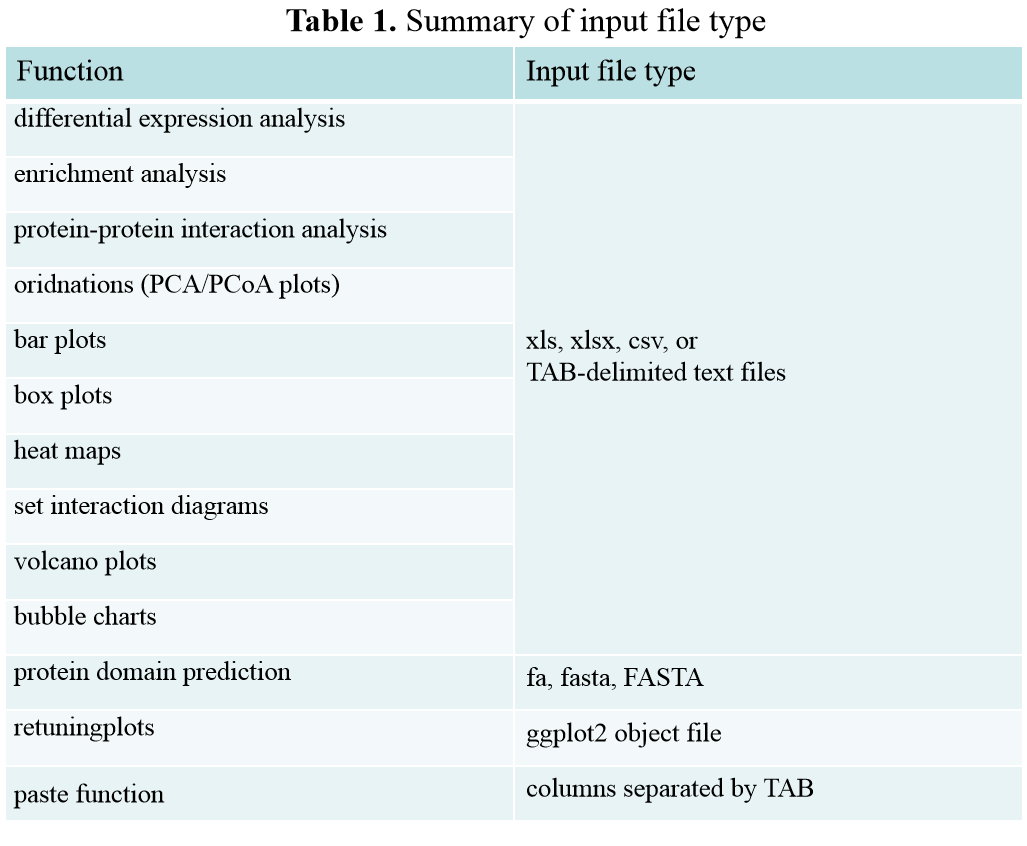
Summary of input file type
Summary of input file type: For uploading files, Visual Omics supports formats including xls, xlsx, csv, tab txt, especially not support unicode txt and space-separated text files. For copying and pasting data, each column needs to be separated by TAB. Tip: Considering that many data files in various formats are dragged and copied under Excel, the data is separated by tabs, so users can open data in many different formats. Copy and paste directly. It should be noted that copying and pasting of files separated by spaces is not supported. There are specific format requirements below each module input file.
Code download
| Version Name | Modify Time | Download | Breif Introdunction |
|---|---|---|---|
| visomics-1.1 | 13 December 2022 | download | Initial release, for code review only |
| visomics-1.2 | 25 June 2023 | download | Updated the R version, modified several bugs, added example usage data and instructions |
Code introduction
Brief introduction: In general, the first step to get calculation results and preliminary pictures, and then the second step to edit the pictures. If you don't need to edit pictures, just execute the first step. Considering that these scripts are used with a large number of parameters on the page, the configuration parameters may be very complicated, especially the second step's parameters may reach hundreds, if you need to adjust the map, please use the web page itself. We provide two examples to demonstrate:
DE Analysis:
$ ./Rversion1.x.R de_analyse 11 ./deanalysis/data_deanalysis 0 ./deanalysis/feature_deanalysis > ./deanalysis/err.txt 2>&1
$ ./Rversion1.x.R 0 01 0 ./deanalysis/user.conf_deanalysis > ./deanalysis/err_01.txt 2>&1
Ordinations:
$ ./Rversion1.x.R ordinations 11 ./ordinations/data_ordinations 0 ./ordinations/feature_ordinations >./ordinations/err.txt 2>&1
$ ./Rversion1.x.R 0 01 0 ./ordinations/user.conf_ordinations >./ordinations/err_01.txt 2>&1
Others:
1. Rversion1.x.R 'x' represents the version, pay attention to modify the corresponding number under the compressed package when running.
2. Before running Rversion1.x.R, please replace the Rscript in the first line with the R path on your computer. Please make sure that your R has installed the R package specified in the script.
3. In fact, the sample files required by different functions can be downloaded on the page, and the data required during operation is actually a file without suffix separated by "\t" corresponding to the sample file. Take the ./ordinations/data_ordinations input as an example, which is actually a sample file available for download in the ordinations section of the page (http://bioinfo.ihb.ac.cn/dj_static/GBTP/magicRversion1/download/ordinations.txt).
DE Analysis
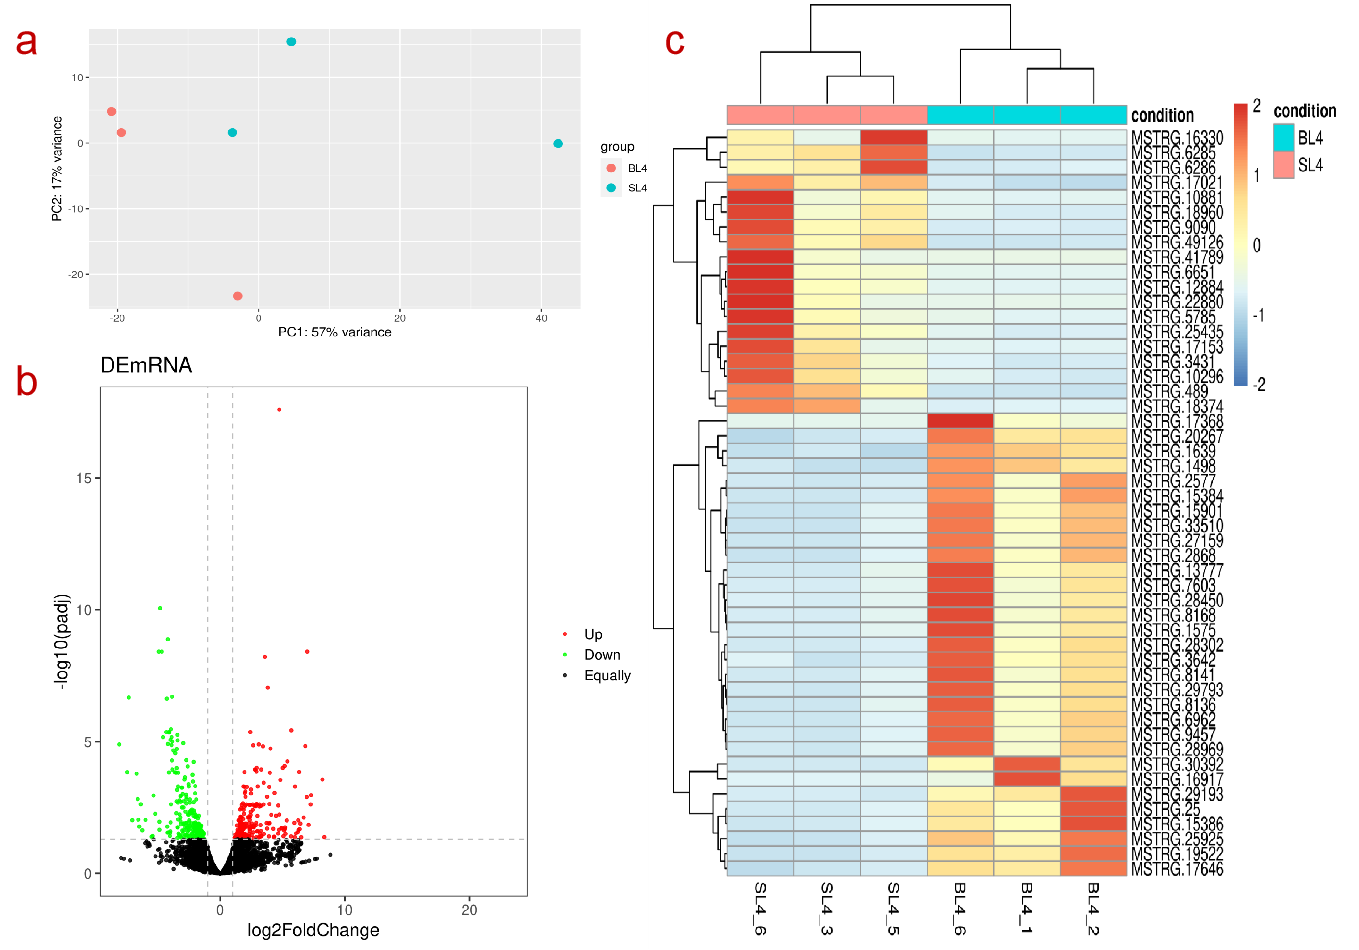
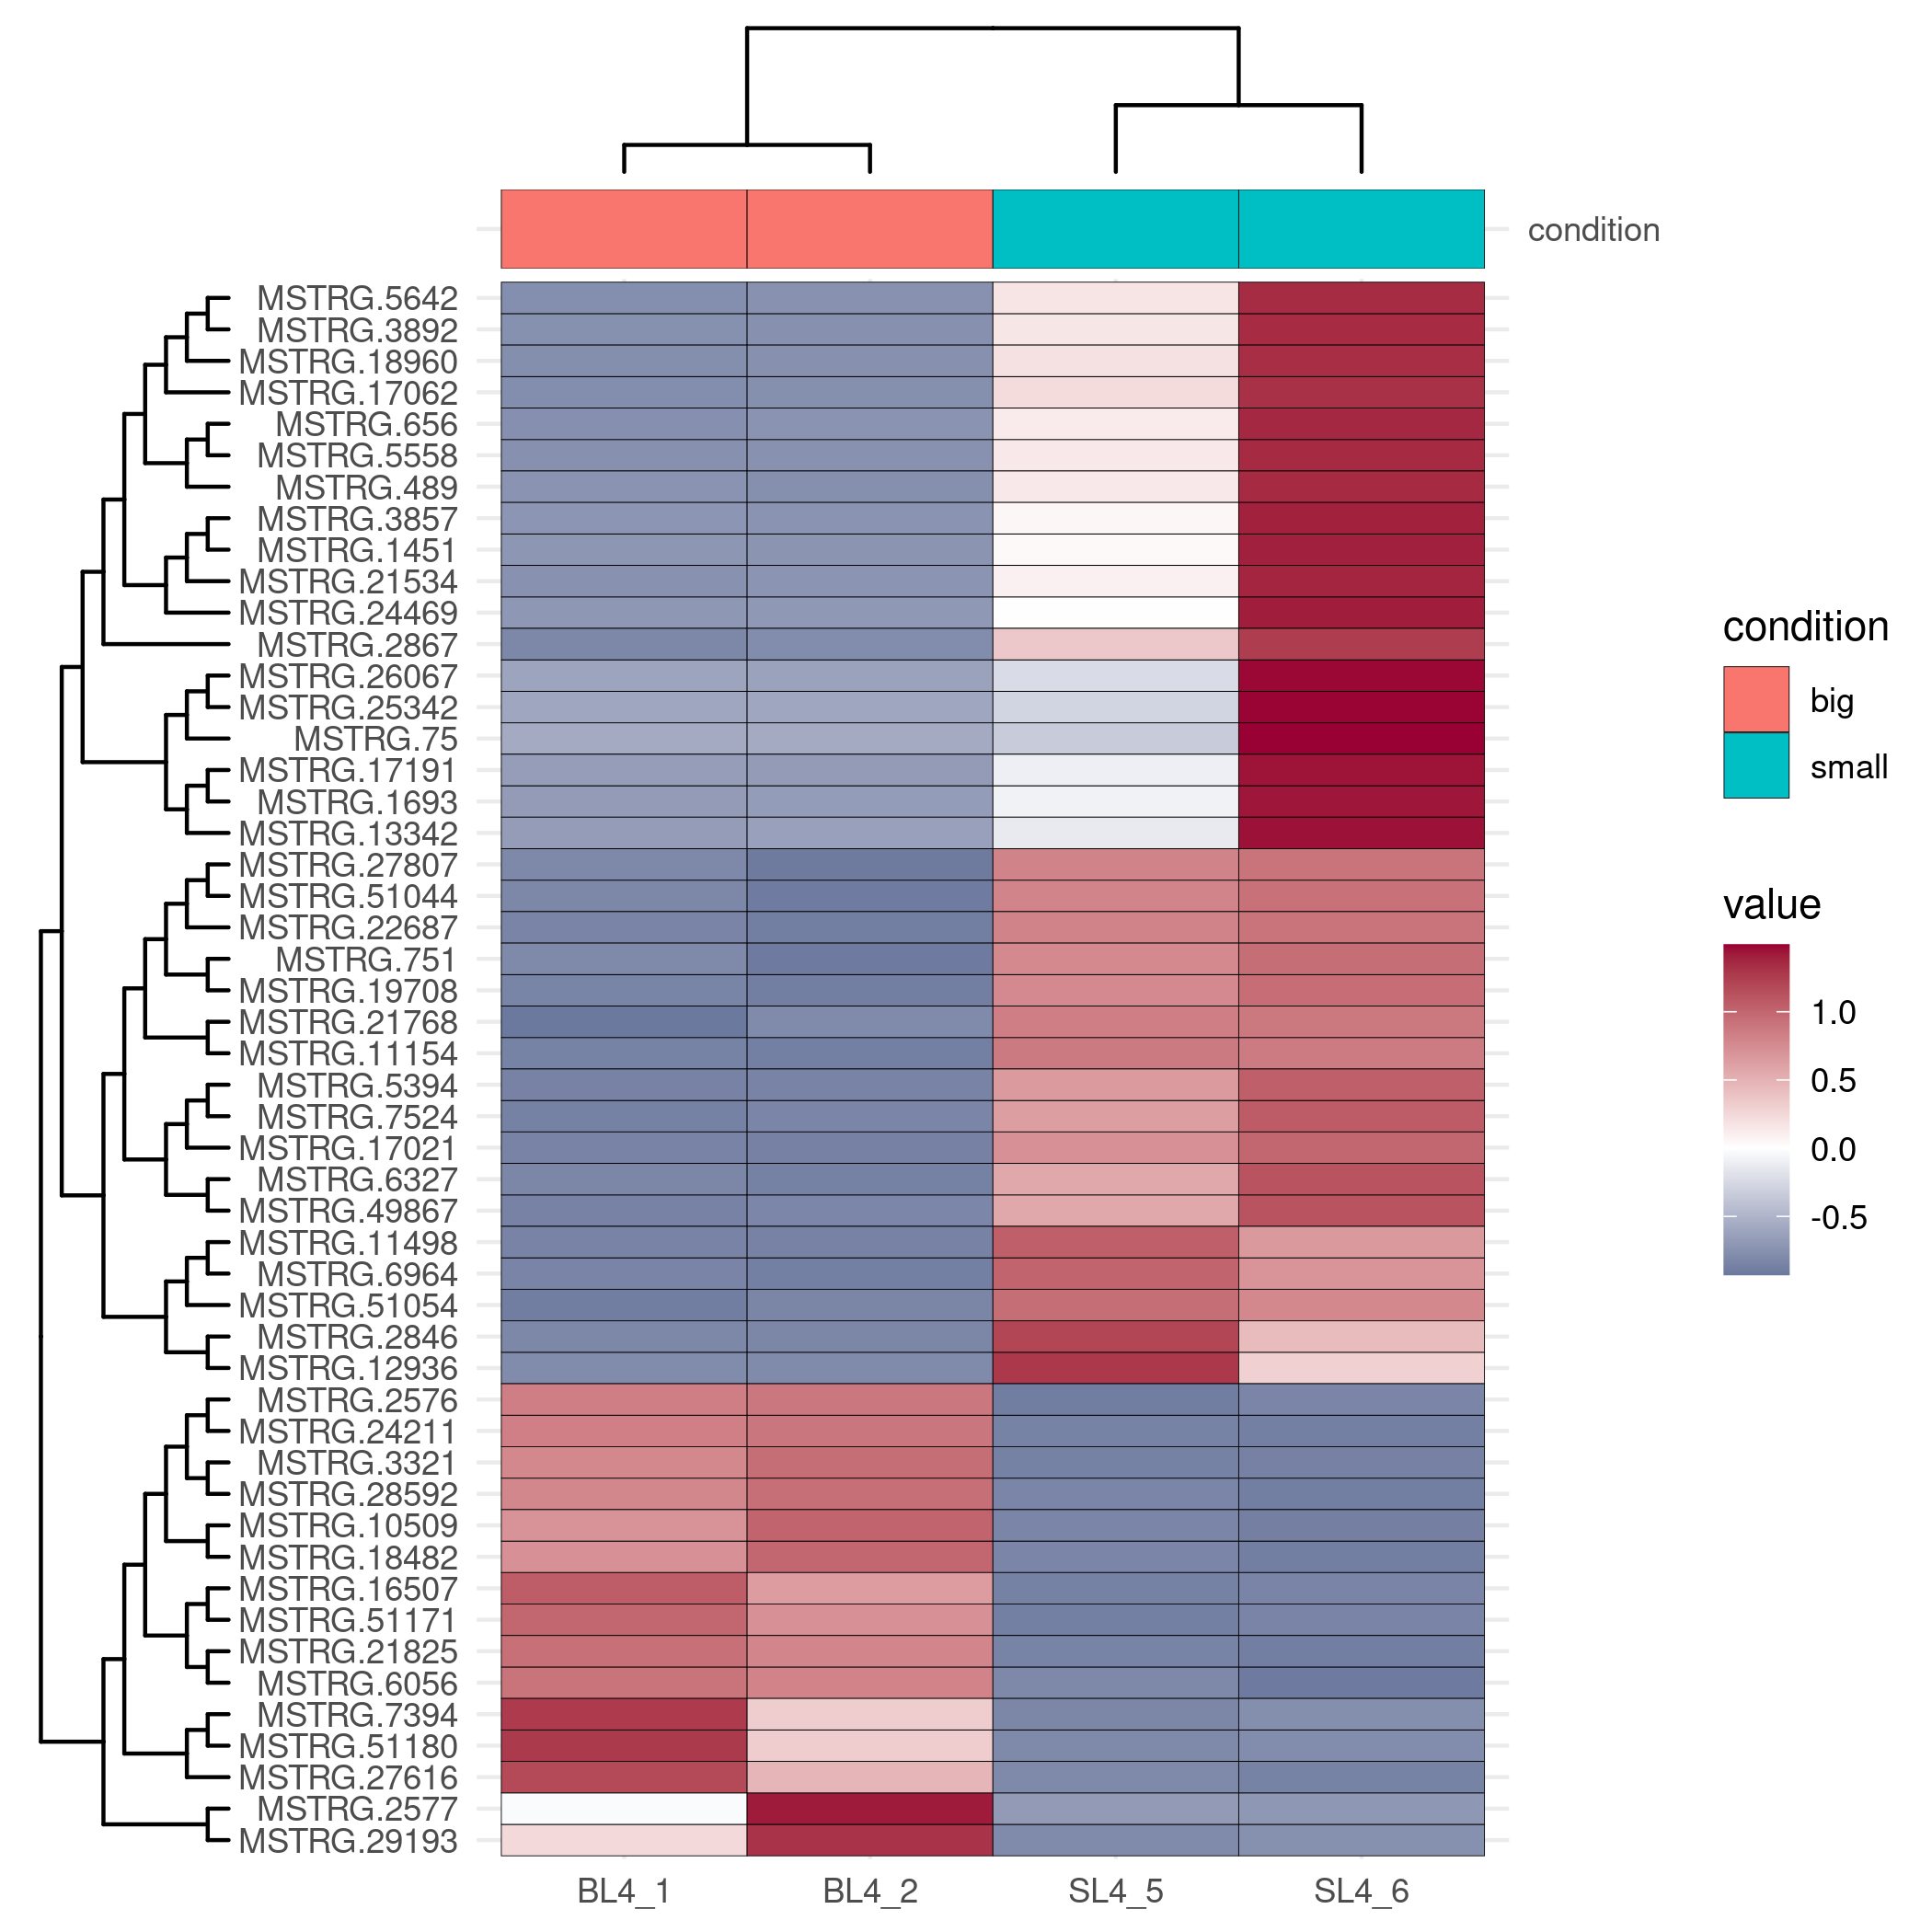
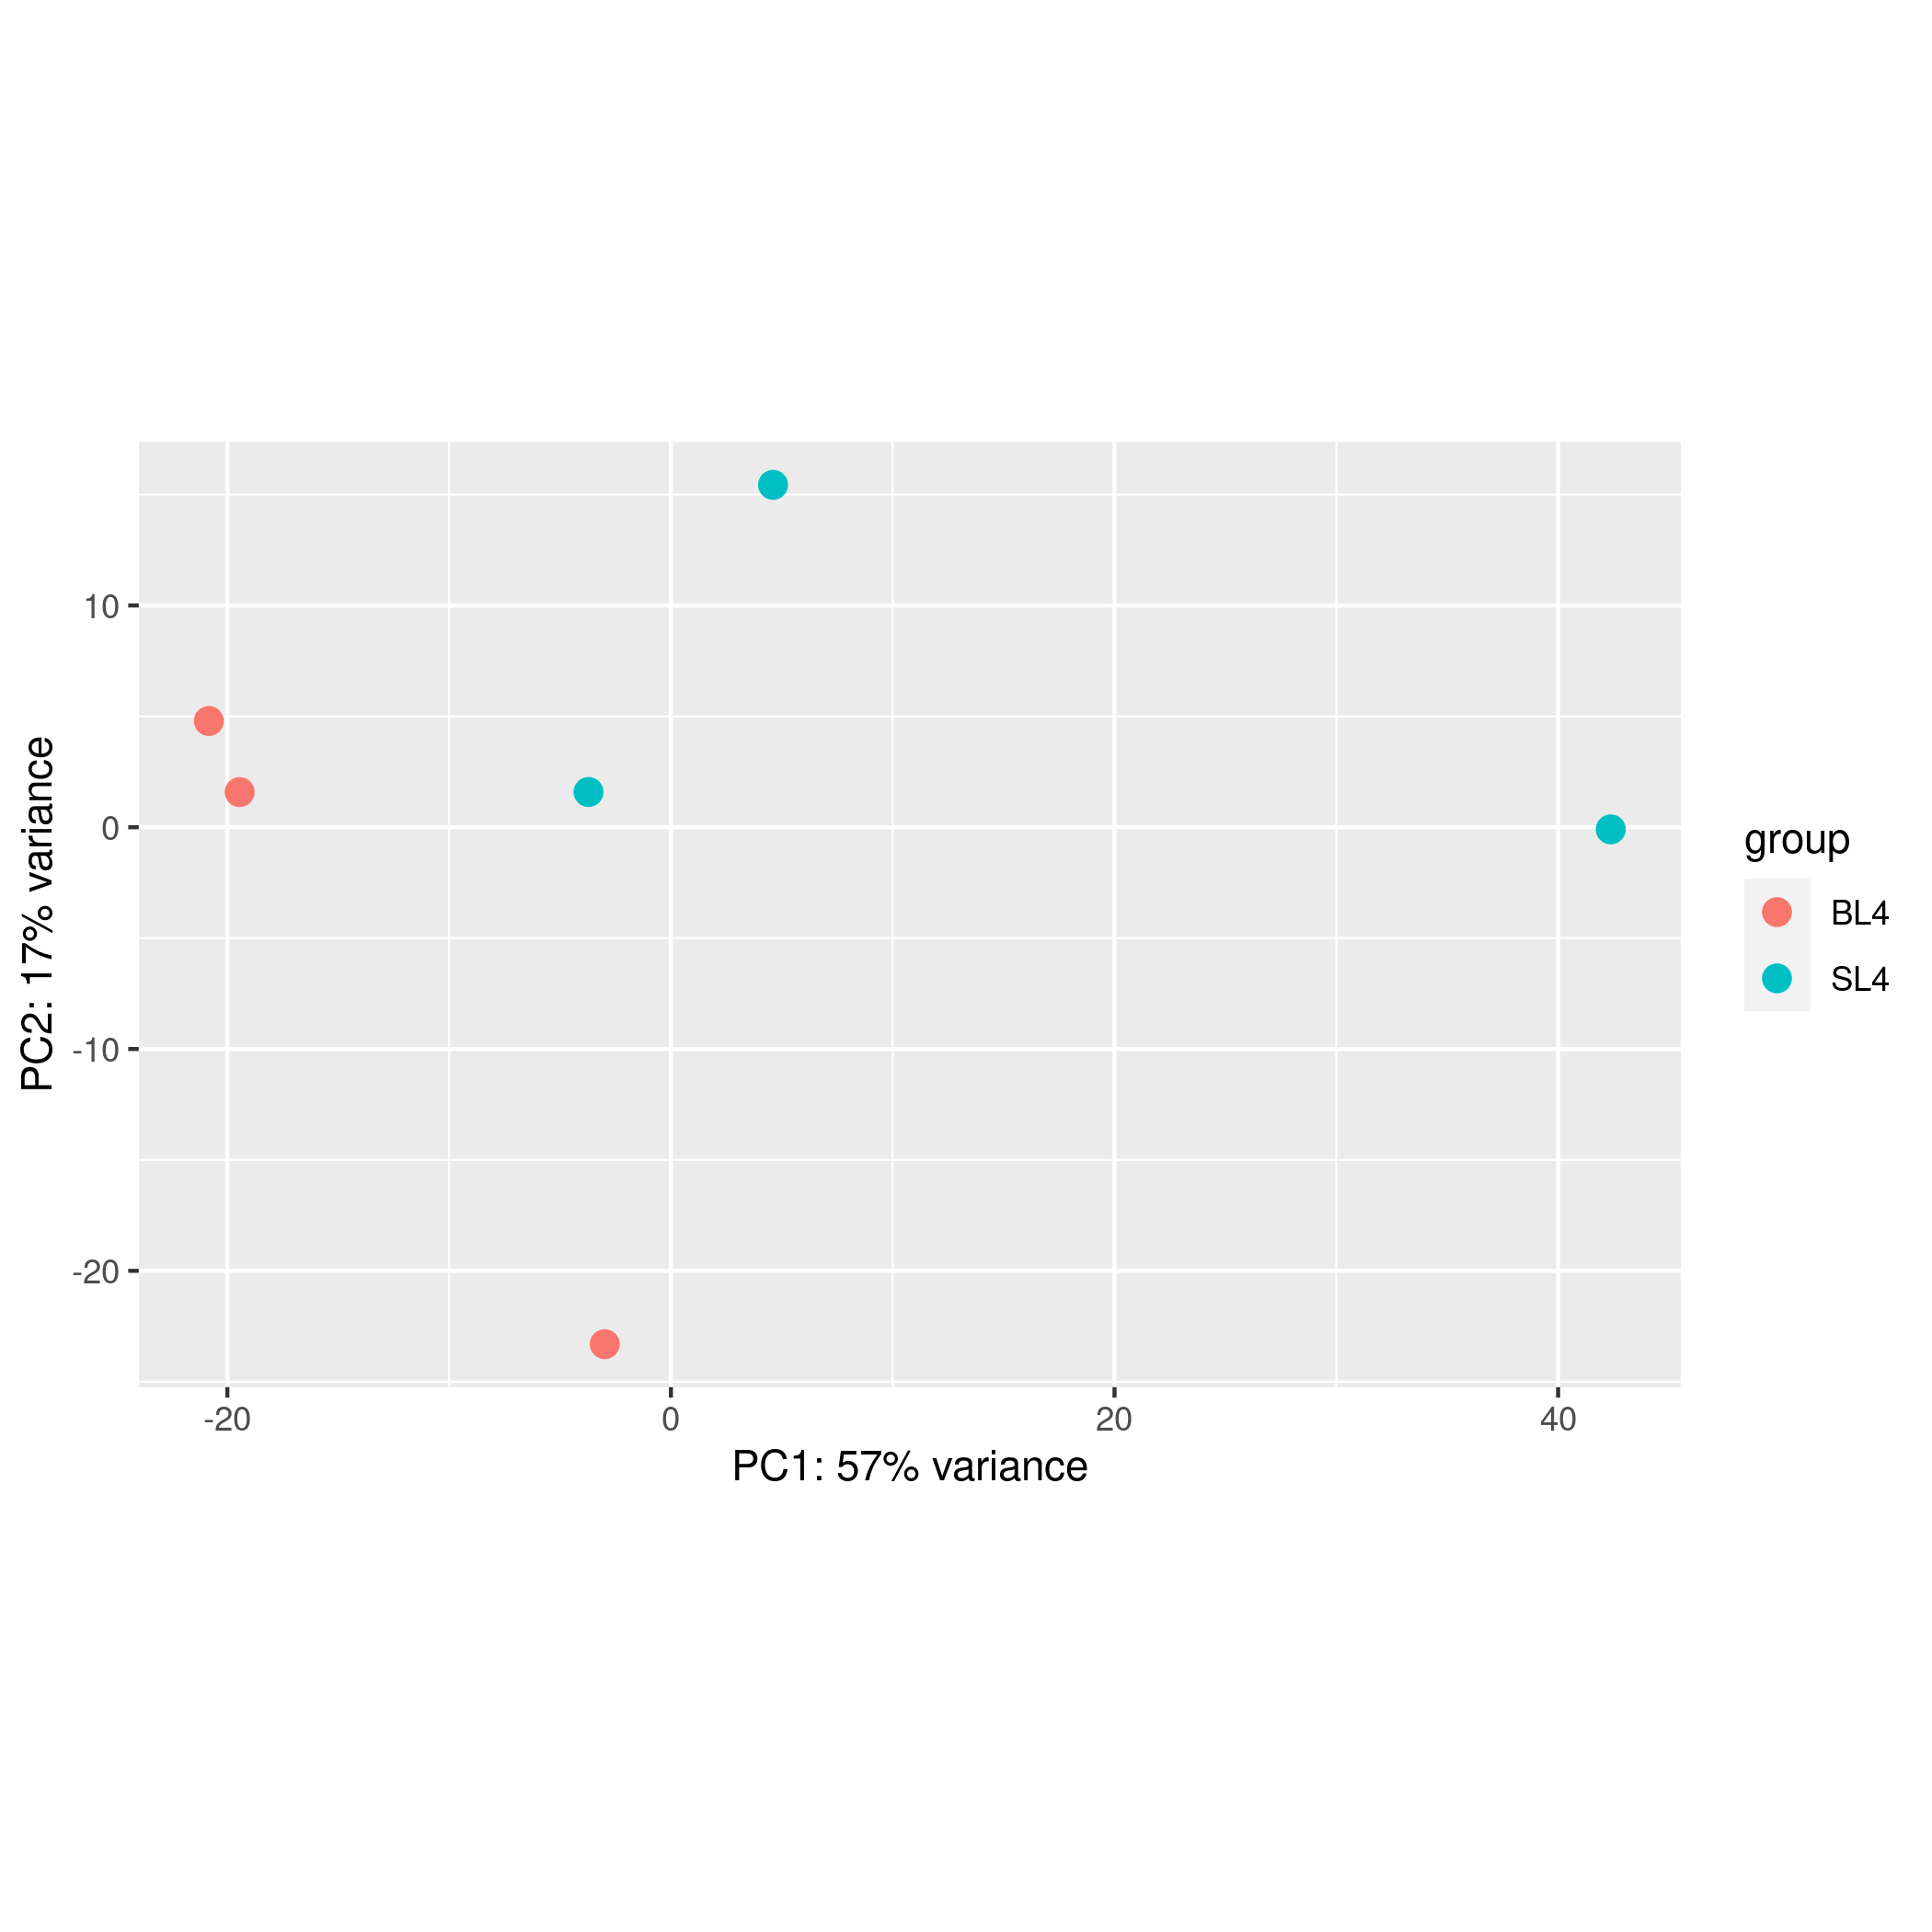
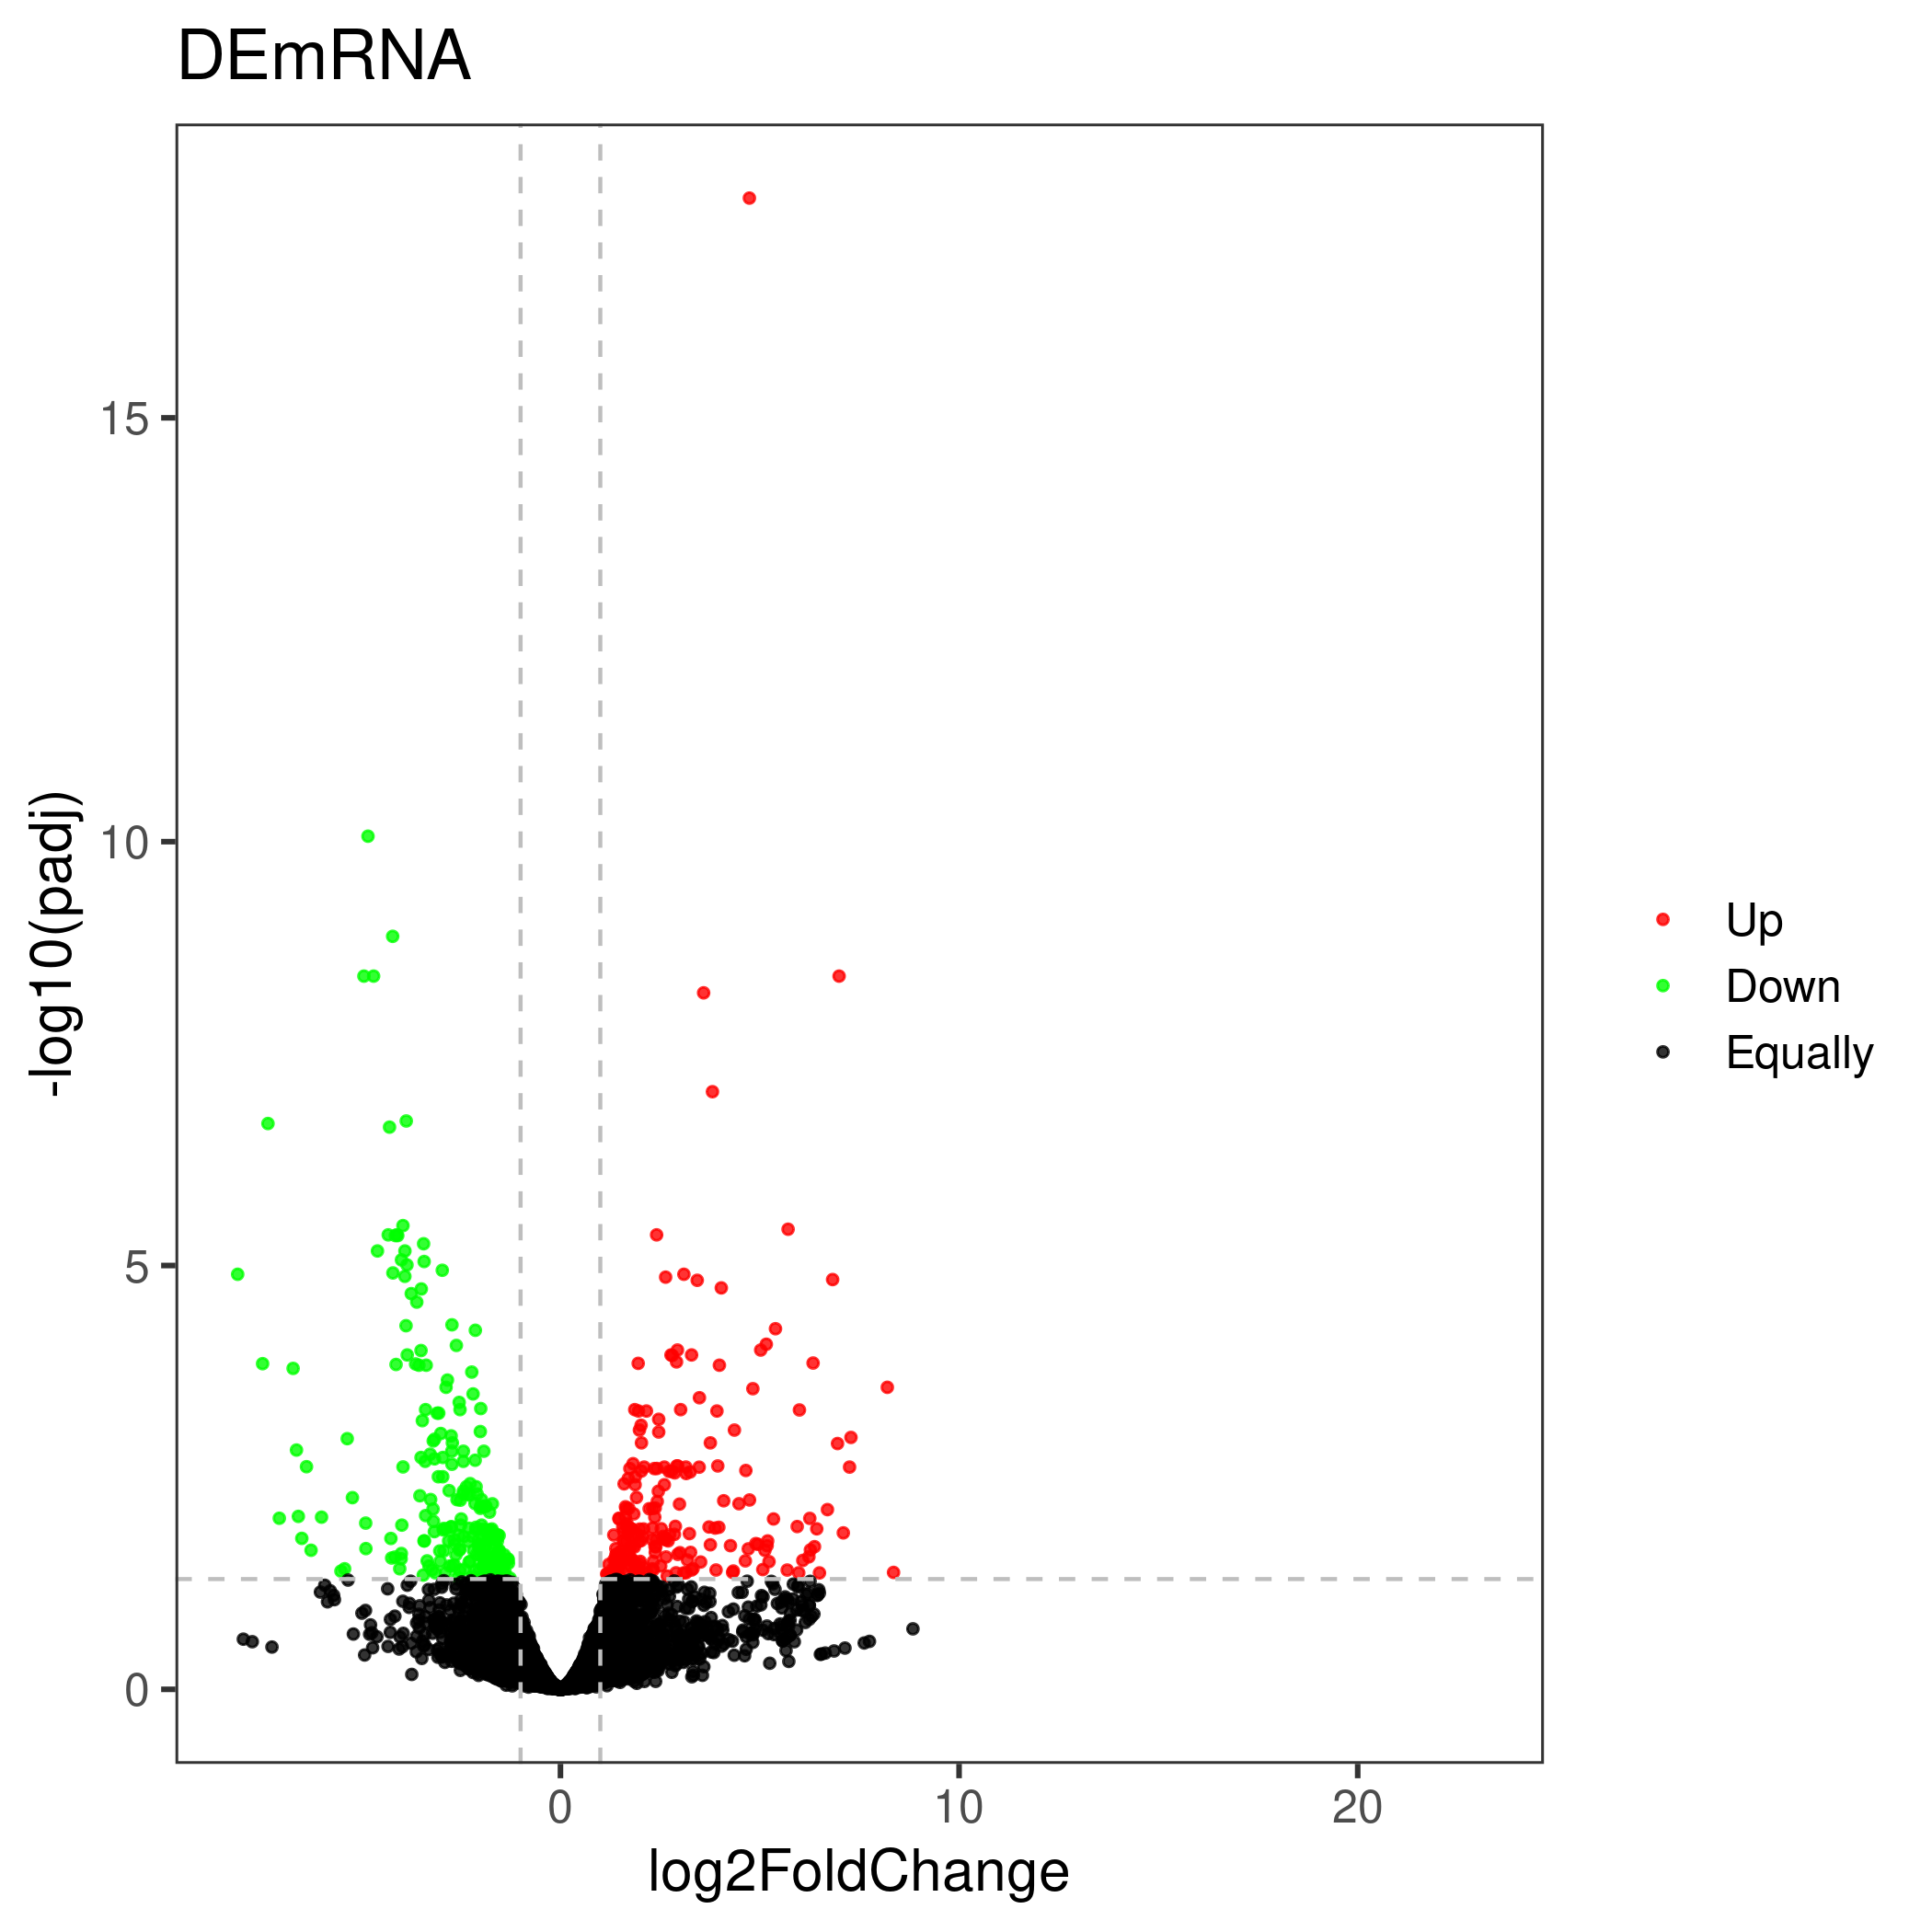
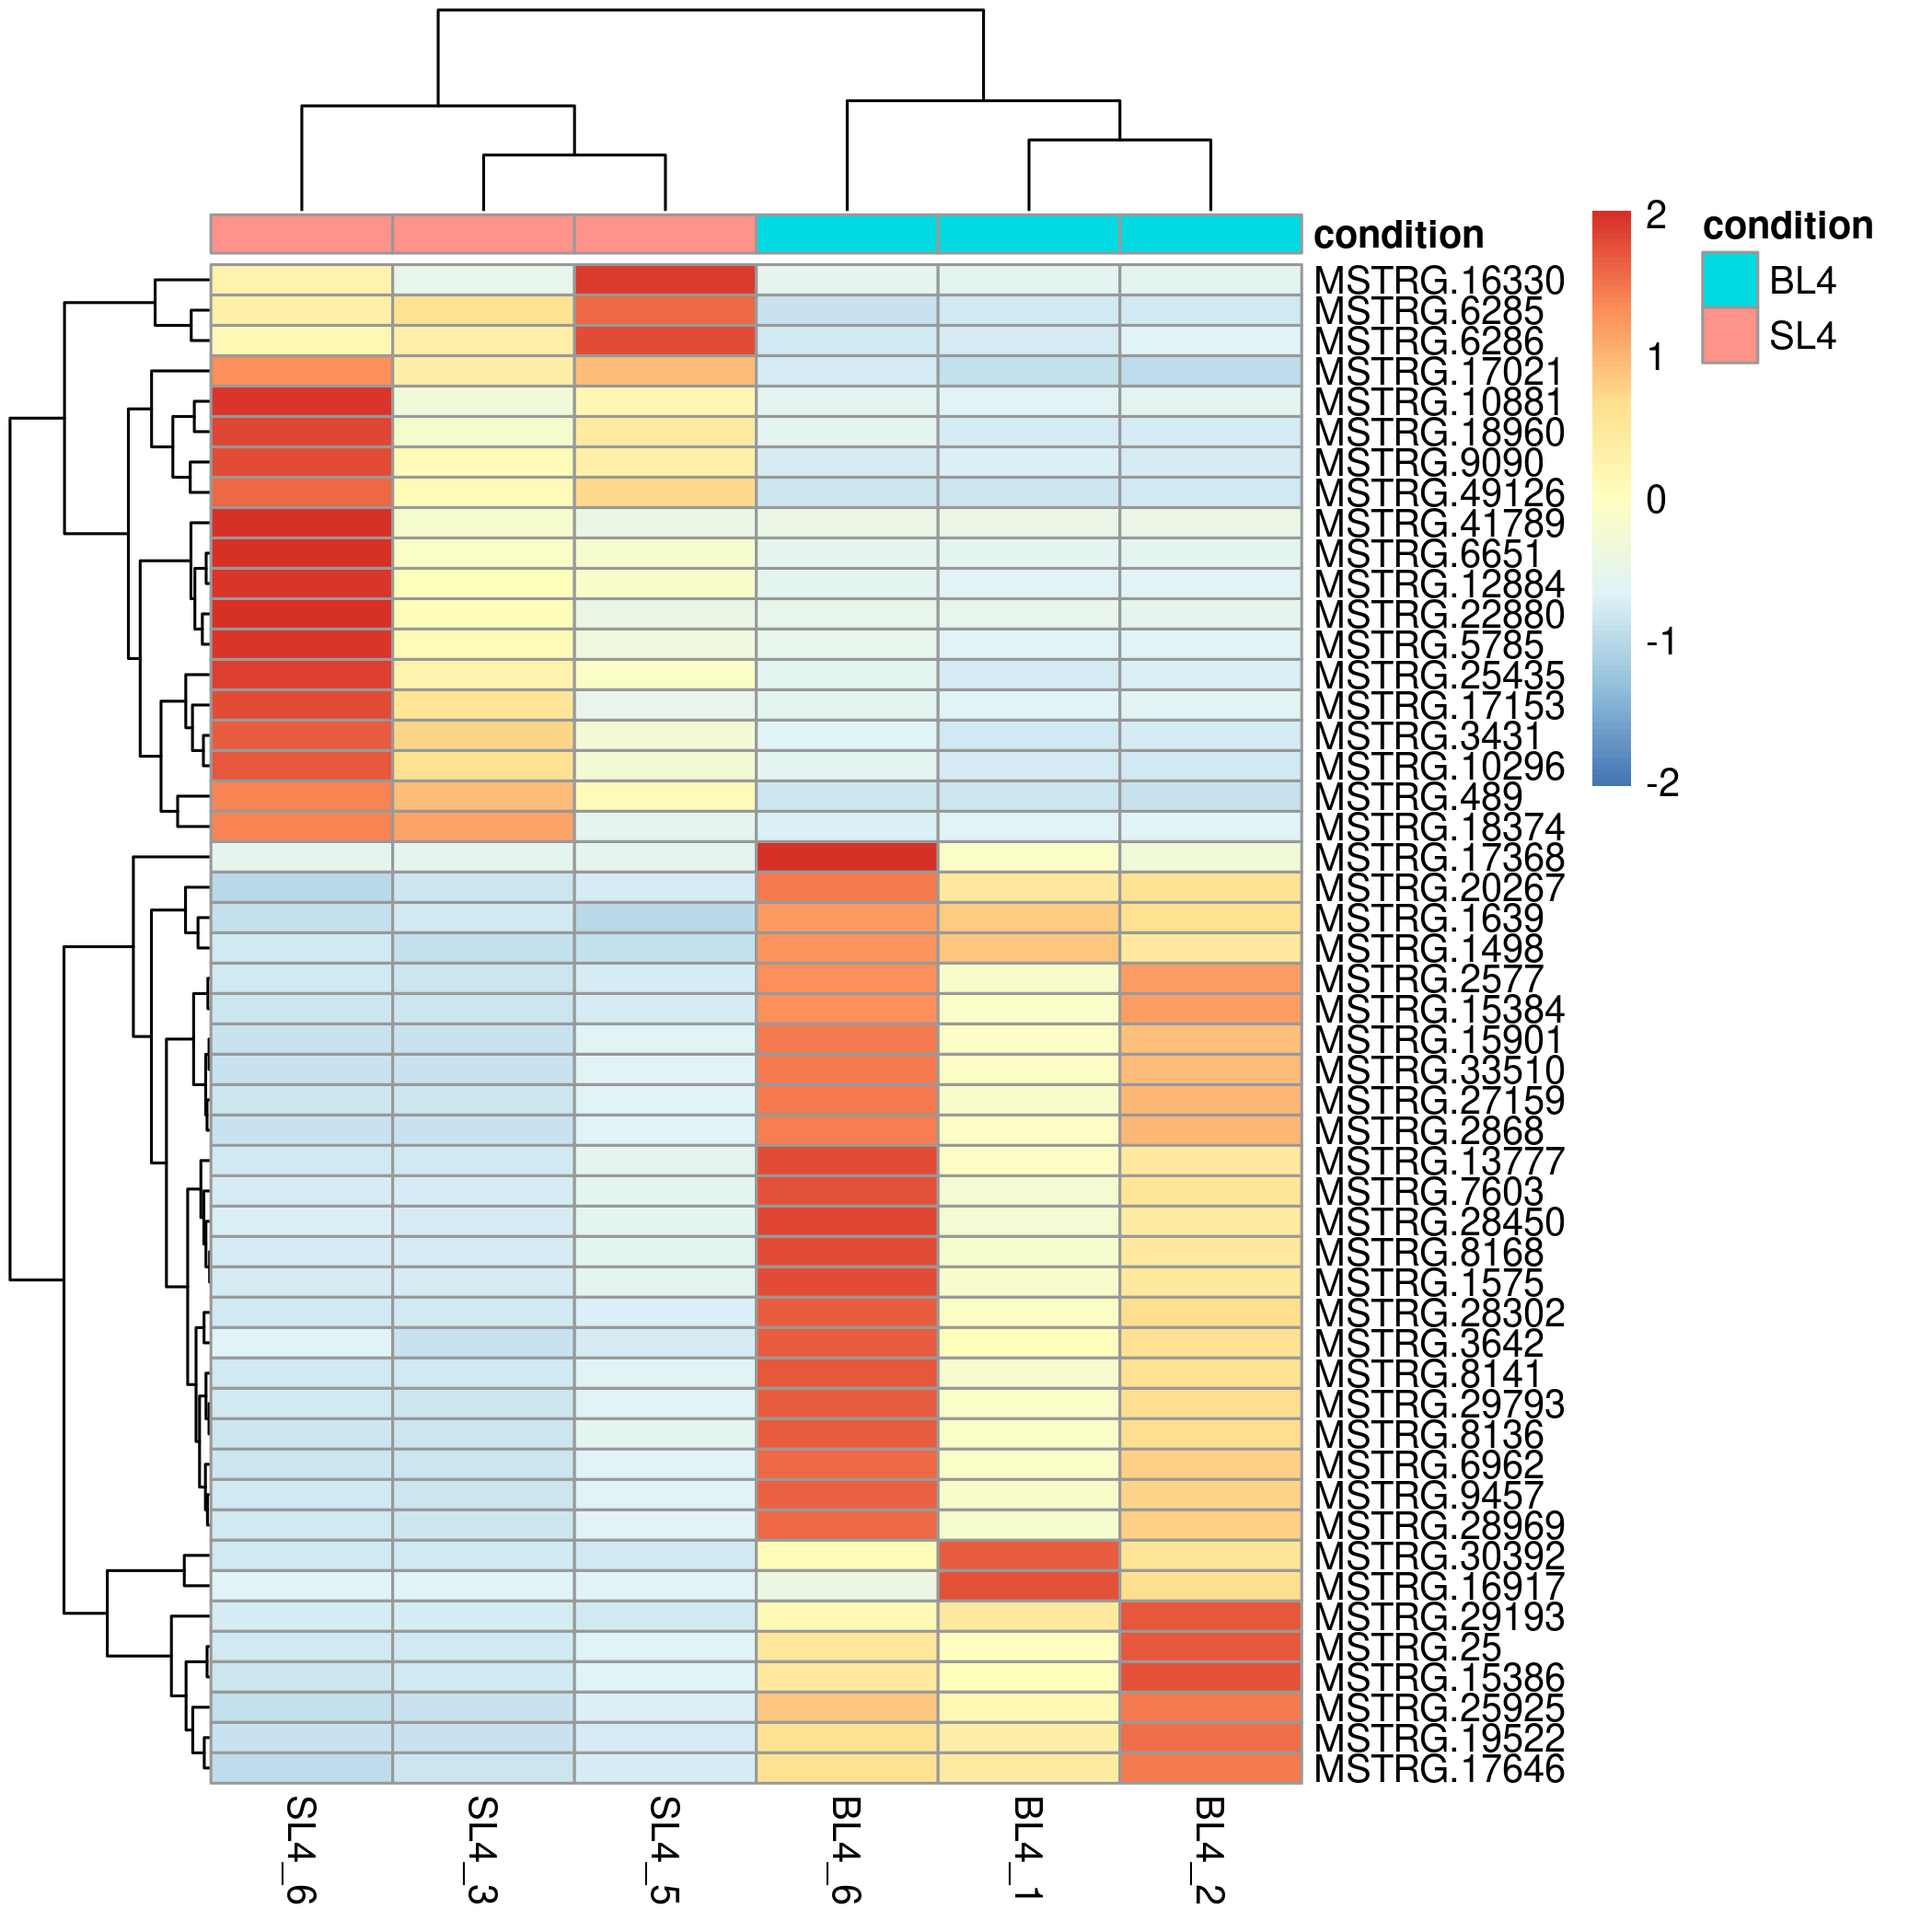
The gene count file and grouping file input by the user can get the output files of the up-regulated and down-regulated genes and the sample pca, differential volcano map, and gene expression heat map output pictures in about one minute. This module mainly powered by R package DESeq2
Steps:
- Input gene count file and input group file
- Select the drawing image type, set the difference parameter adjusted P value (default 0.05), log2FC (default 0), and set the heat map display parameter (default ranked in the top 50 in ascending P value order).
- Click to start and download the output analysis results and corresponding pictures
|
1. [ Required ] Upload the file for gene expression information: Note: paste part only support TAB-delimited content as in the example file. |
|---|
|
2. [ Required ] Upload the file for group information: Note: paste part only support TAB-delimited content as in the example file. |
|
1. [ Required ] Upload the file for gene epression information: Note: only supports csv, xls, xlsx, txt ( TAB-delimited ) as in the example file, and does not support unicode type files. |
|---|
|
2. [ Required ] Upload the file for group information: Note: only supports csv, xls, xlsx, txt ( TAB-delimited ) as in the example file, and does not support unicode type files. |
3. Main parameters:
Filter low-expressed genes, at least
meet the number of reads of more than
Genes with a significance test p-value less than
And the absolute value of the fold change greater than
will be marked as significantly different.
The top
in ascending p-value order of the
regulation will be plotted as a heatmap.
Add sample group:
Data transform:
Add hclust on sample and gene:
Enrichment Analysis
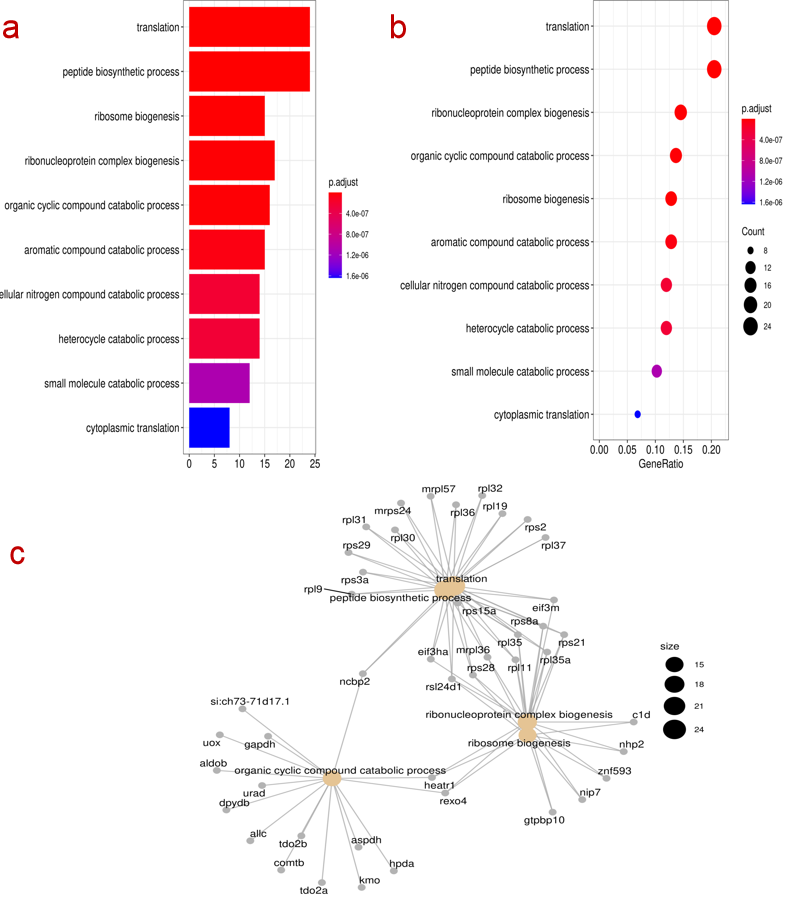
The underlying foundation of enrichment analysis is the clusterProfiler R package, and the id conversion function uses the mapIds function of the Annotation package. The functions of this module include GO and KEGG data analysis with and without parameters, among which the involved genomes are provided by bioconductor, including ten popular model organisms including human, mouse, and zebrafish. For the enrichment analysis of the parameter-free genome, the user needs to provide the background file of the gene, that is, the KO id or GO id of the gene.
Steps:
- Input genes file ( no reference genome need to enter the background annotation file )
- Select the column name with gene id in the input file, select the analysis type GO/KEGG, select the p value, select the verification method, select the background species.
- Click to start and download the output analysis results and corresponding pictures.
|
1. [ Required ] Paste the file which contain colnum gene symbol or ncbi id or ensembl id: Note: paste part only support TAB-delimited content as in the example file. It is worth noting that the input file must require column names.The example file is the standard file of DEseq2 output results. In fact, the user input file only needs to contain a column of gene symbol/ID. |
|---|
|
2. [ Optional ] Upload the file for background annotation file of the gene: Note: paste part only support TAB-delimited content as in the GO example file, KEGG Pathway example file. |
|
1. [ Required ] which contain colnum gene symbol or ncbi id or ensembl id: Note: only supports csv, xls, xlsx, txt ( TAB-delimited ) as in the example file,and does not support unicode type files. It is worth noting that the input file must require column names.The example file is the standard file of DEseq2 output results. In fact, the user input file only needs to contain a column of gene symbol/ID. |
|---|
|
2. [ Optional ] Upload background annotation file of the gene: Note: only supports csv, xls, xlsx, txt ( TAB-delimited ) as in the GO example file, KEGG Pathway example file, and does not support unicode type files. It is worth noting that the input file must require column names |
3. Main parameters:
[ Required ]Select the column name that contains the gene name/gene id in the uploaded file:
The type of data the uploaded file contains:
Analysis type:
Only biological pathways or GO terms with a p-value less than:
after:
checks will be marked significantly
Have reference genome annotation:
Choose a reference genome:
Background target ID/symbol
GO/KO ID
Go enrichment classification display:
Transform the y-axis data:
Protein Domain Prediction
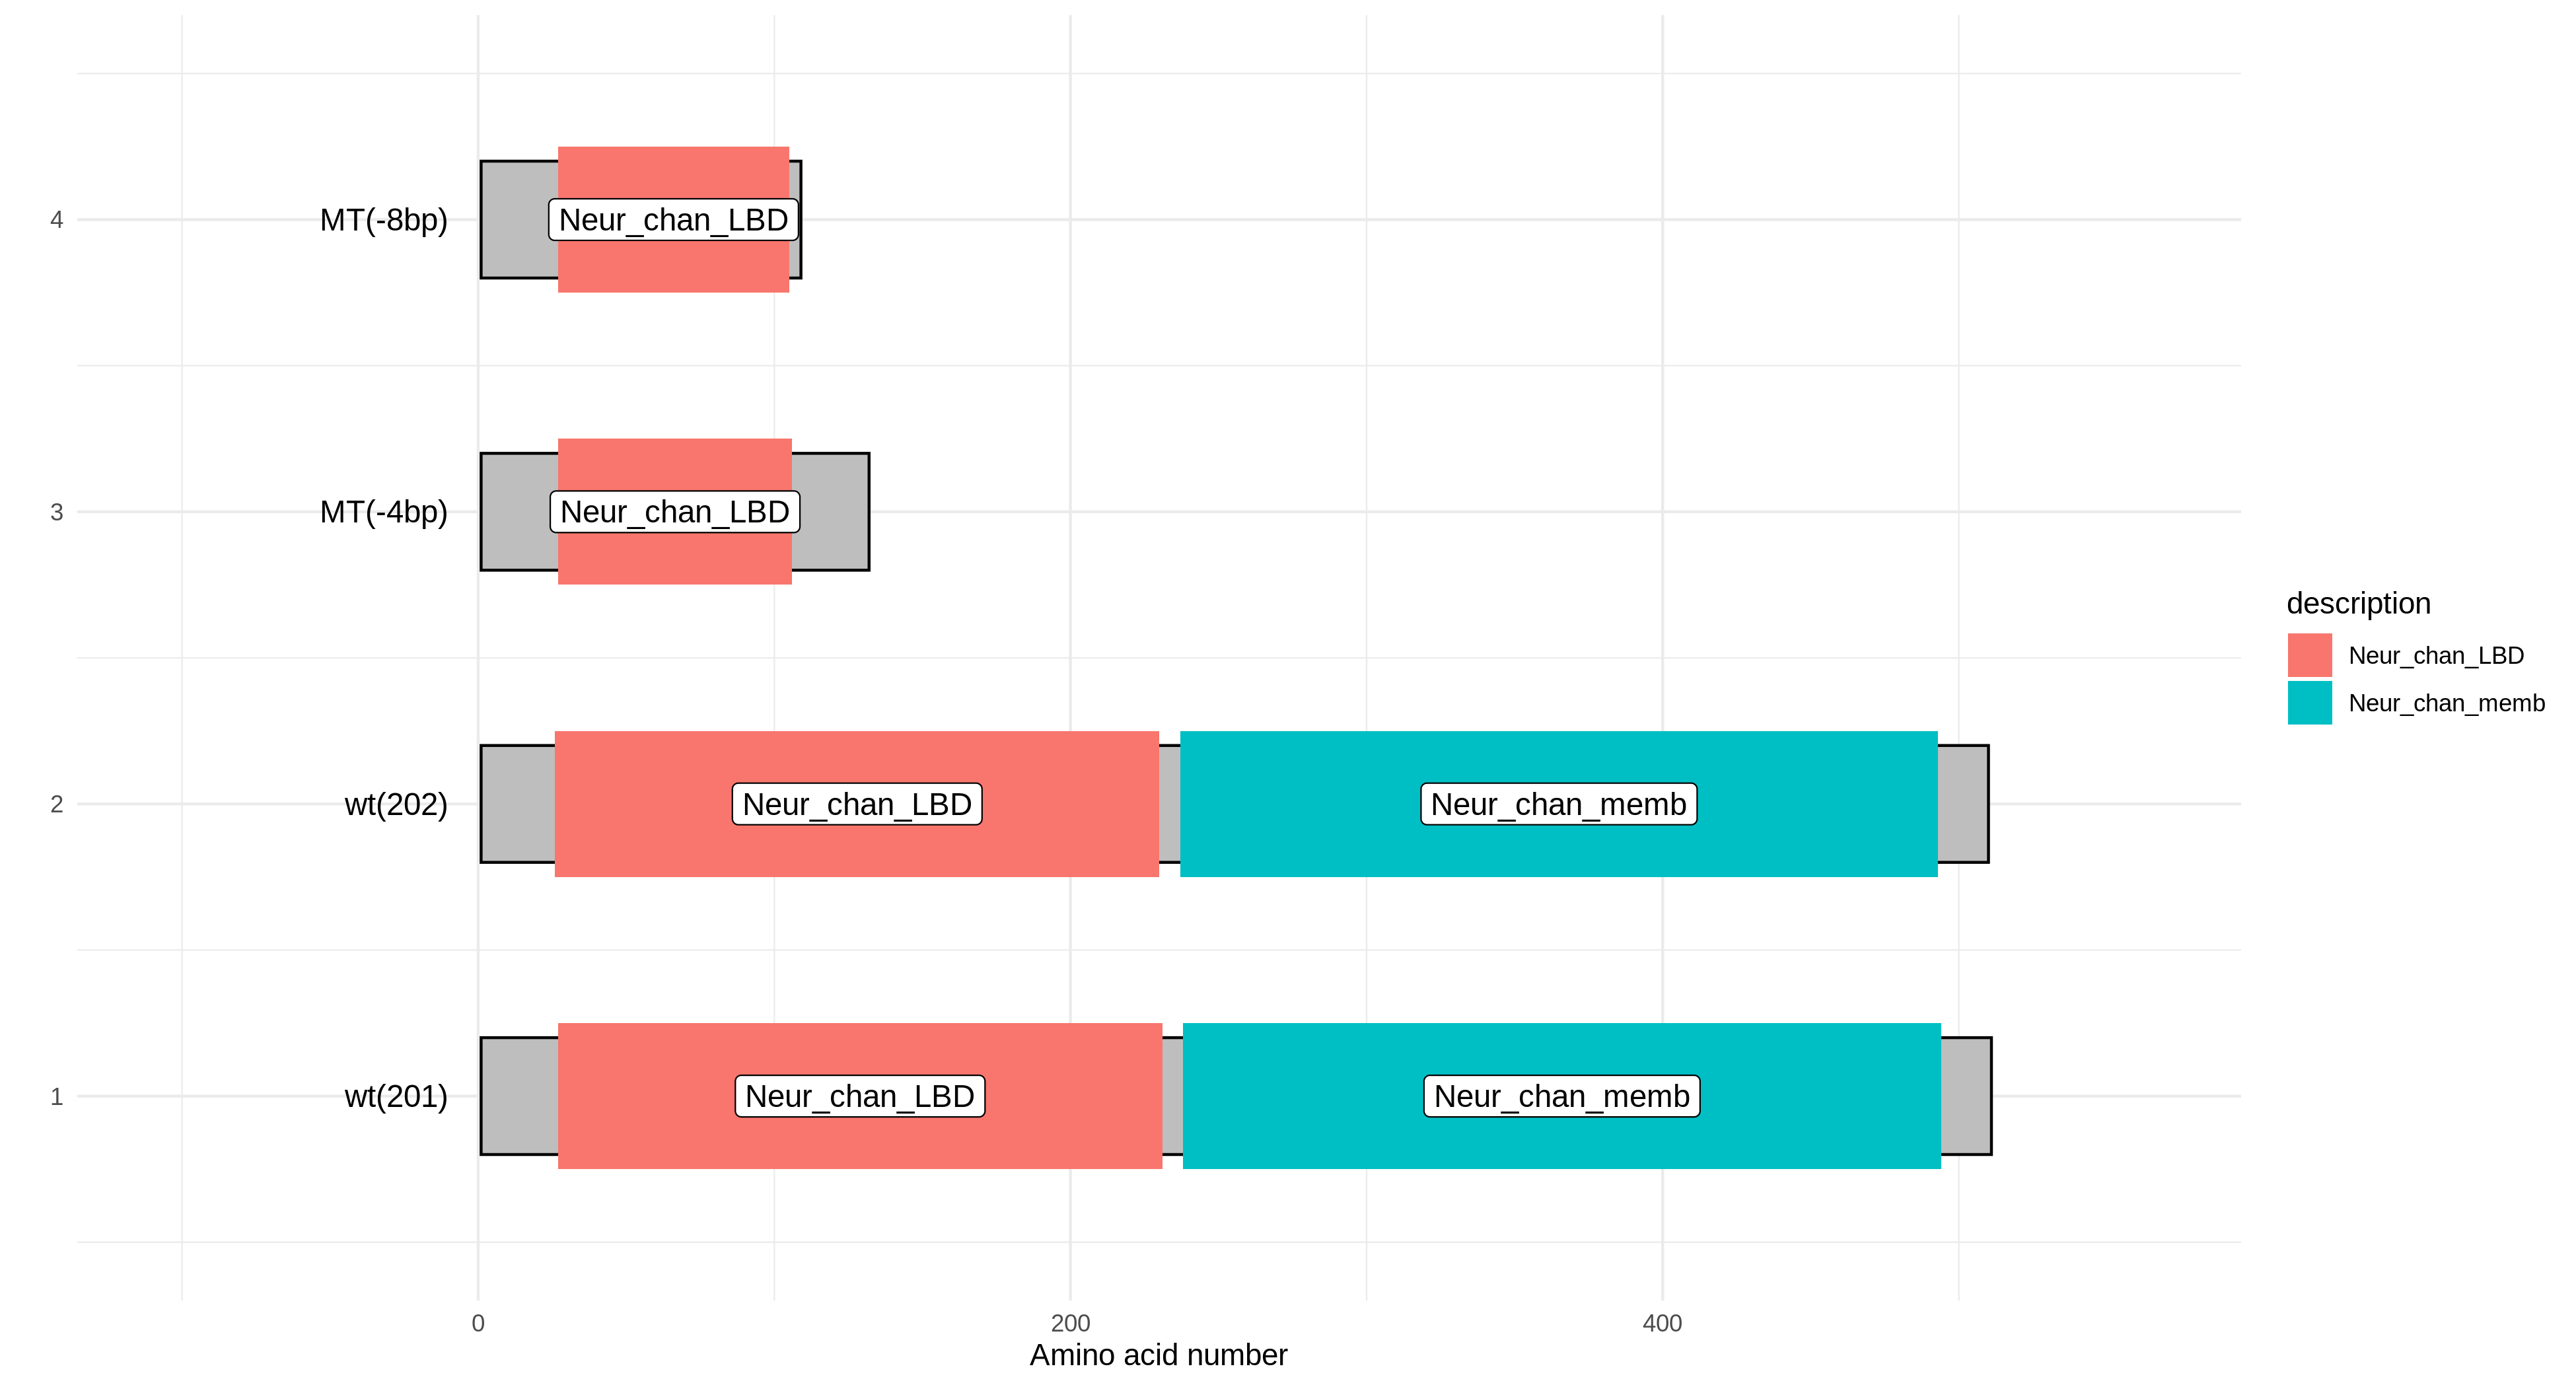
The gene protein sequences entered by the user are aligned with the Pfam-A.hmm data, and then the alignment results are visualized based on the R package drawProteins.
|
1. [Required] Paste the file which like fasta file: Note: only supports fasta type file as in the example file. Please note that when entering multiple protein sequences, If the sequence name appears the same, the system will add the sequence suffix >xxxx_number in the order in the input file |
|---|
|
1. [ Required ] which contain colnum gene symbol or NCBI or Ensembl ID: Note: only supports fasta type file as in the example file, and does not support unicode type files. |
|---|
Protein Interaction Prediction
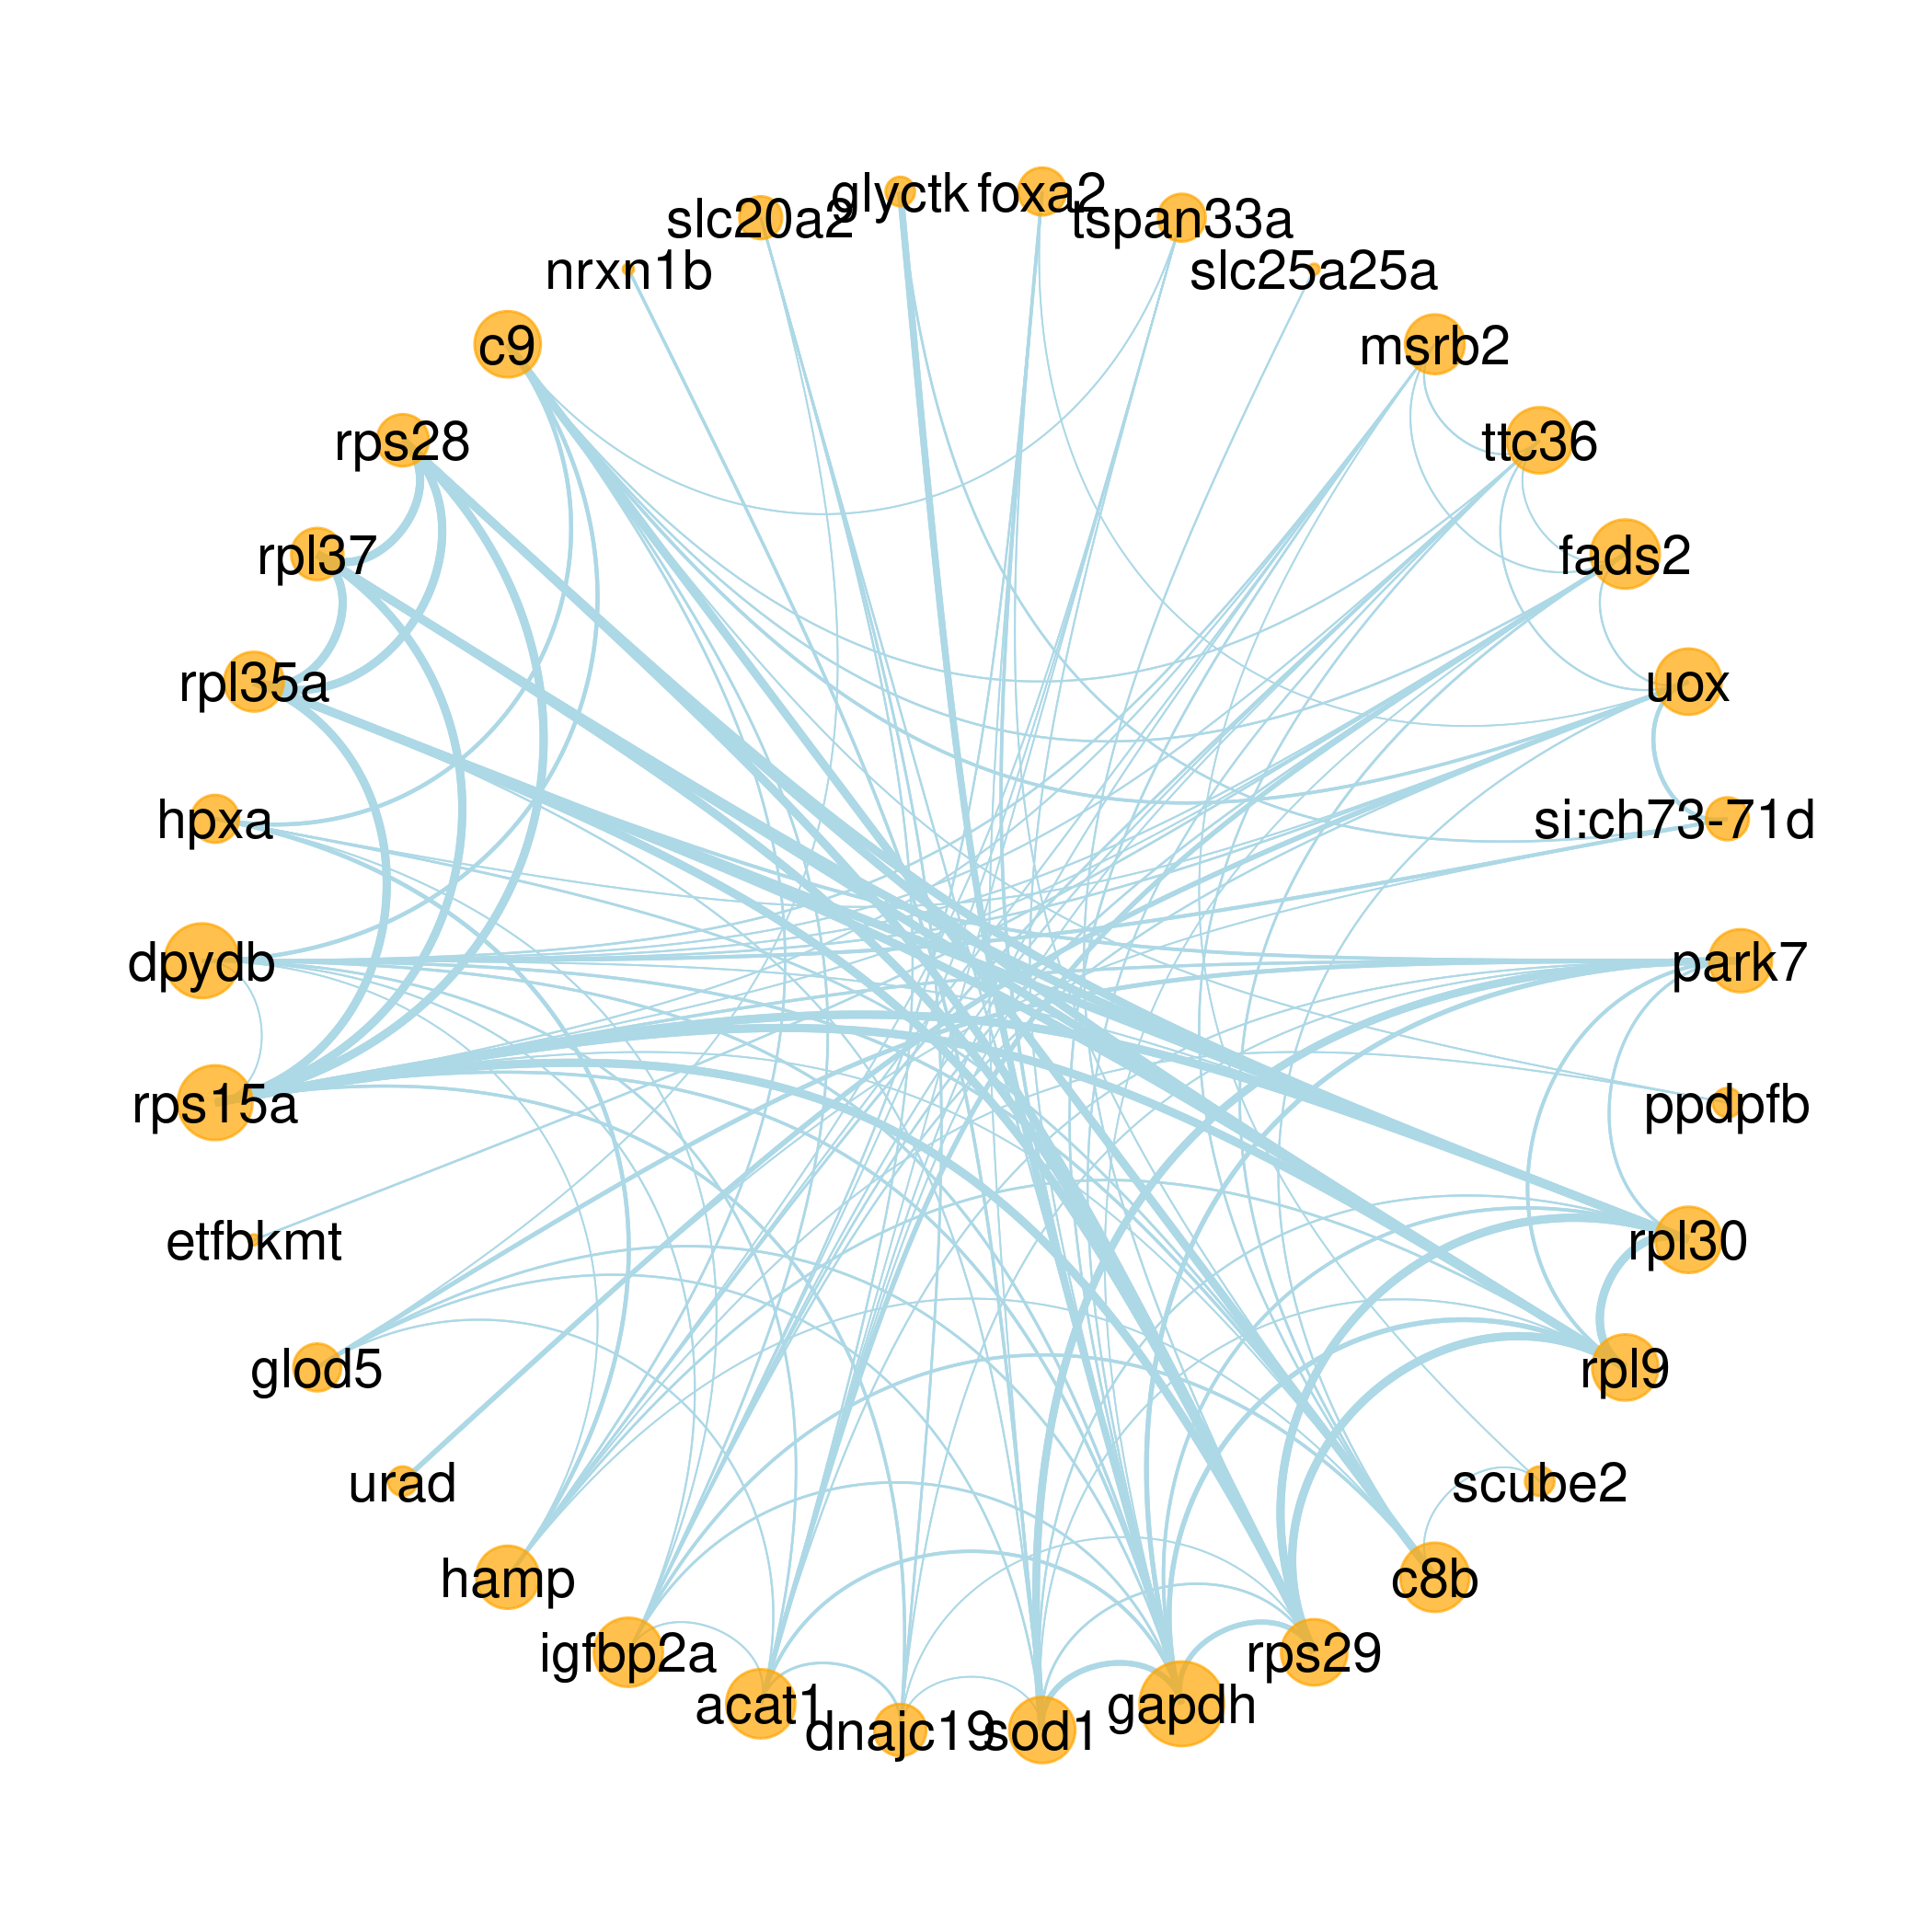
This module mainly relies on the STRING database for protein interaction prediction. For the single visualization of the STRING database (V11.5), our later visualization is mainly displayed by the ggraph package. This module is dedicated to protein interaction prediction and publication-level mapping in one website.
|
1. [ Required ] Paste the file which Must include a column of gene symbol or gene ncbi/ebi id: Note: paste part only support TAB-delimited content as in the example file. It is worth noting that the input file must require column names.The example file is the standard file of DEseq2 output results. In fact, the user input file only needs to contain a column of gene symbol/ID. |
|---|
|
1. [ Required ] which Must include a column of gene symbol or gene NCBI/Ensembl ID: Note: only supports csv, xls, xlsx, txt ( TAB-delimited ) as in the example file,and does not support unicode type files. It is worth noting that the input file must require column names.The example file is the standard file of DEseq2 output results. In fact, the user input file only needs to contain a column of gene symbol/ID. |
|---|
2. Main parameters:
[ Required ]Select the column name that contains the gene name/gene ID in the uploaded file:
The type of data the uploaded file contains:
Choose a reference genome:
and score_threshold:
Removed free interactions:
Choose a layout:
and edge style:
and edge colour:
Node colour:
and node alpha:
Add node text:
Dege greater than
and repel:
and size:
Retuning Plots
Users can upload the ggplot2 object generated by Visual Omics, so that users can continue to modify the style based on the object. Even better, users can upload native ggplot2 objects, but require additional background information from the user. Users can easily and happily adjust the picture style with the help of the Visual Omics picture adjustment system without having to remember hundreds of ggplot2 style parameters.
|
1. [ Required ] : Note: Support users to upload ggplot2 object files as in the example file(produced by visual omics), or Native ggplot2 object file. |
|---|
2. Main parameters:
Choose different ggplot2 source:
X-axis data type:
Y-axis data type:
The data is
and represented by
There are continuous data to be mapped into point size:
Need to adjust point size:
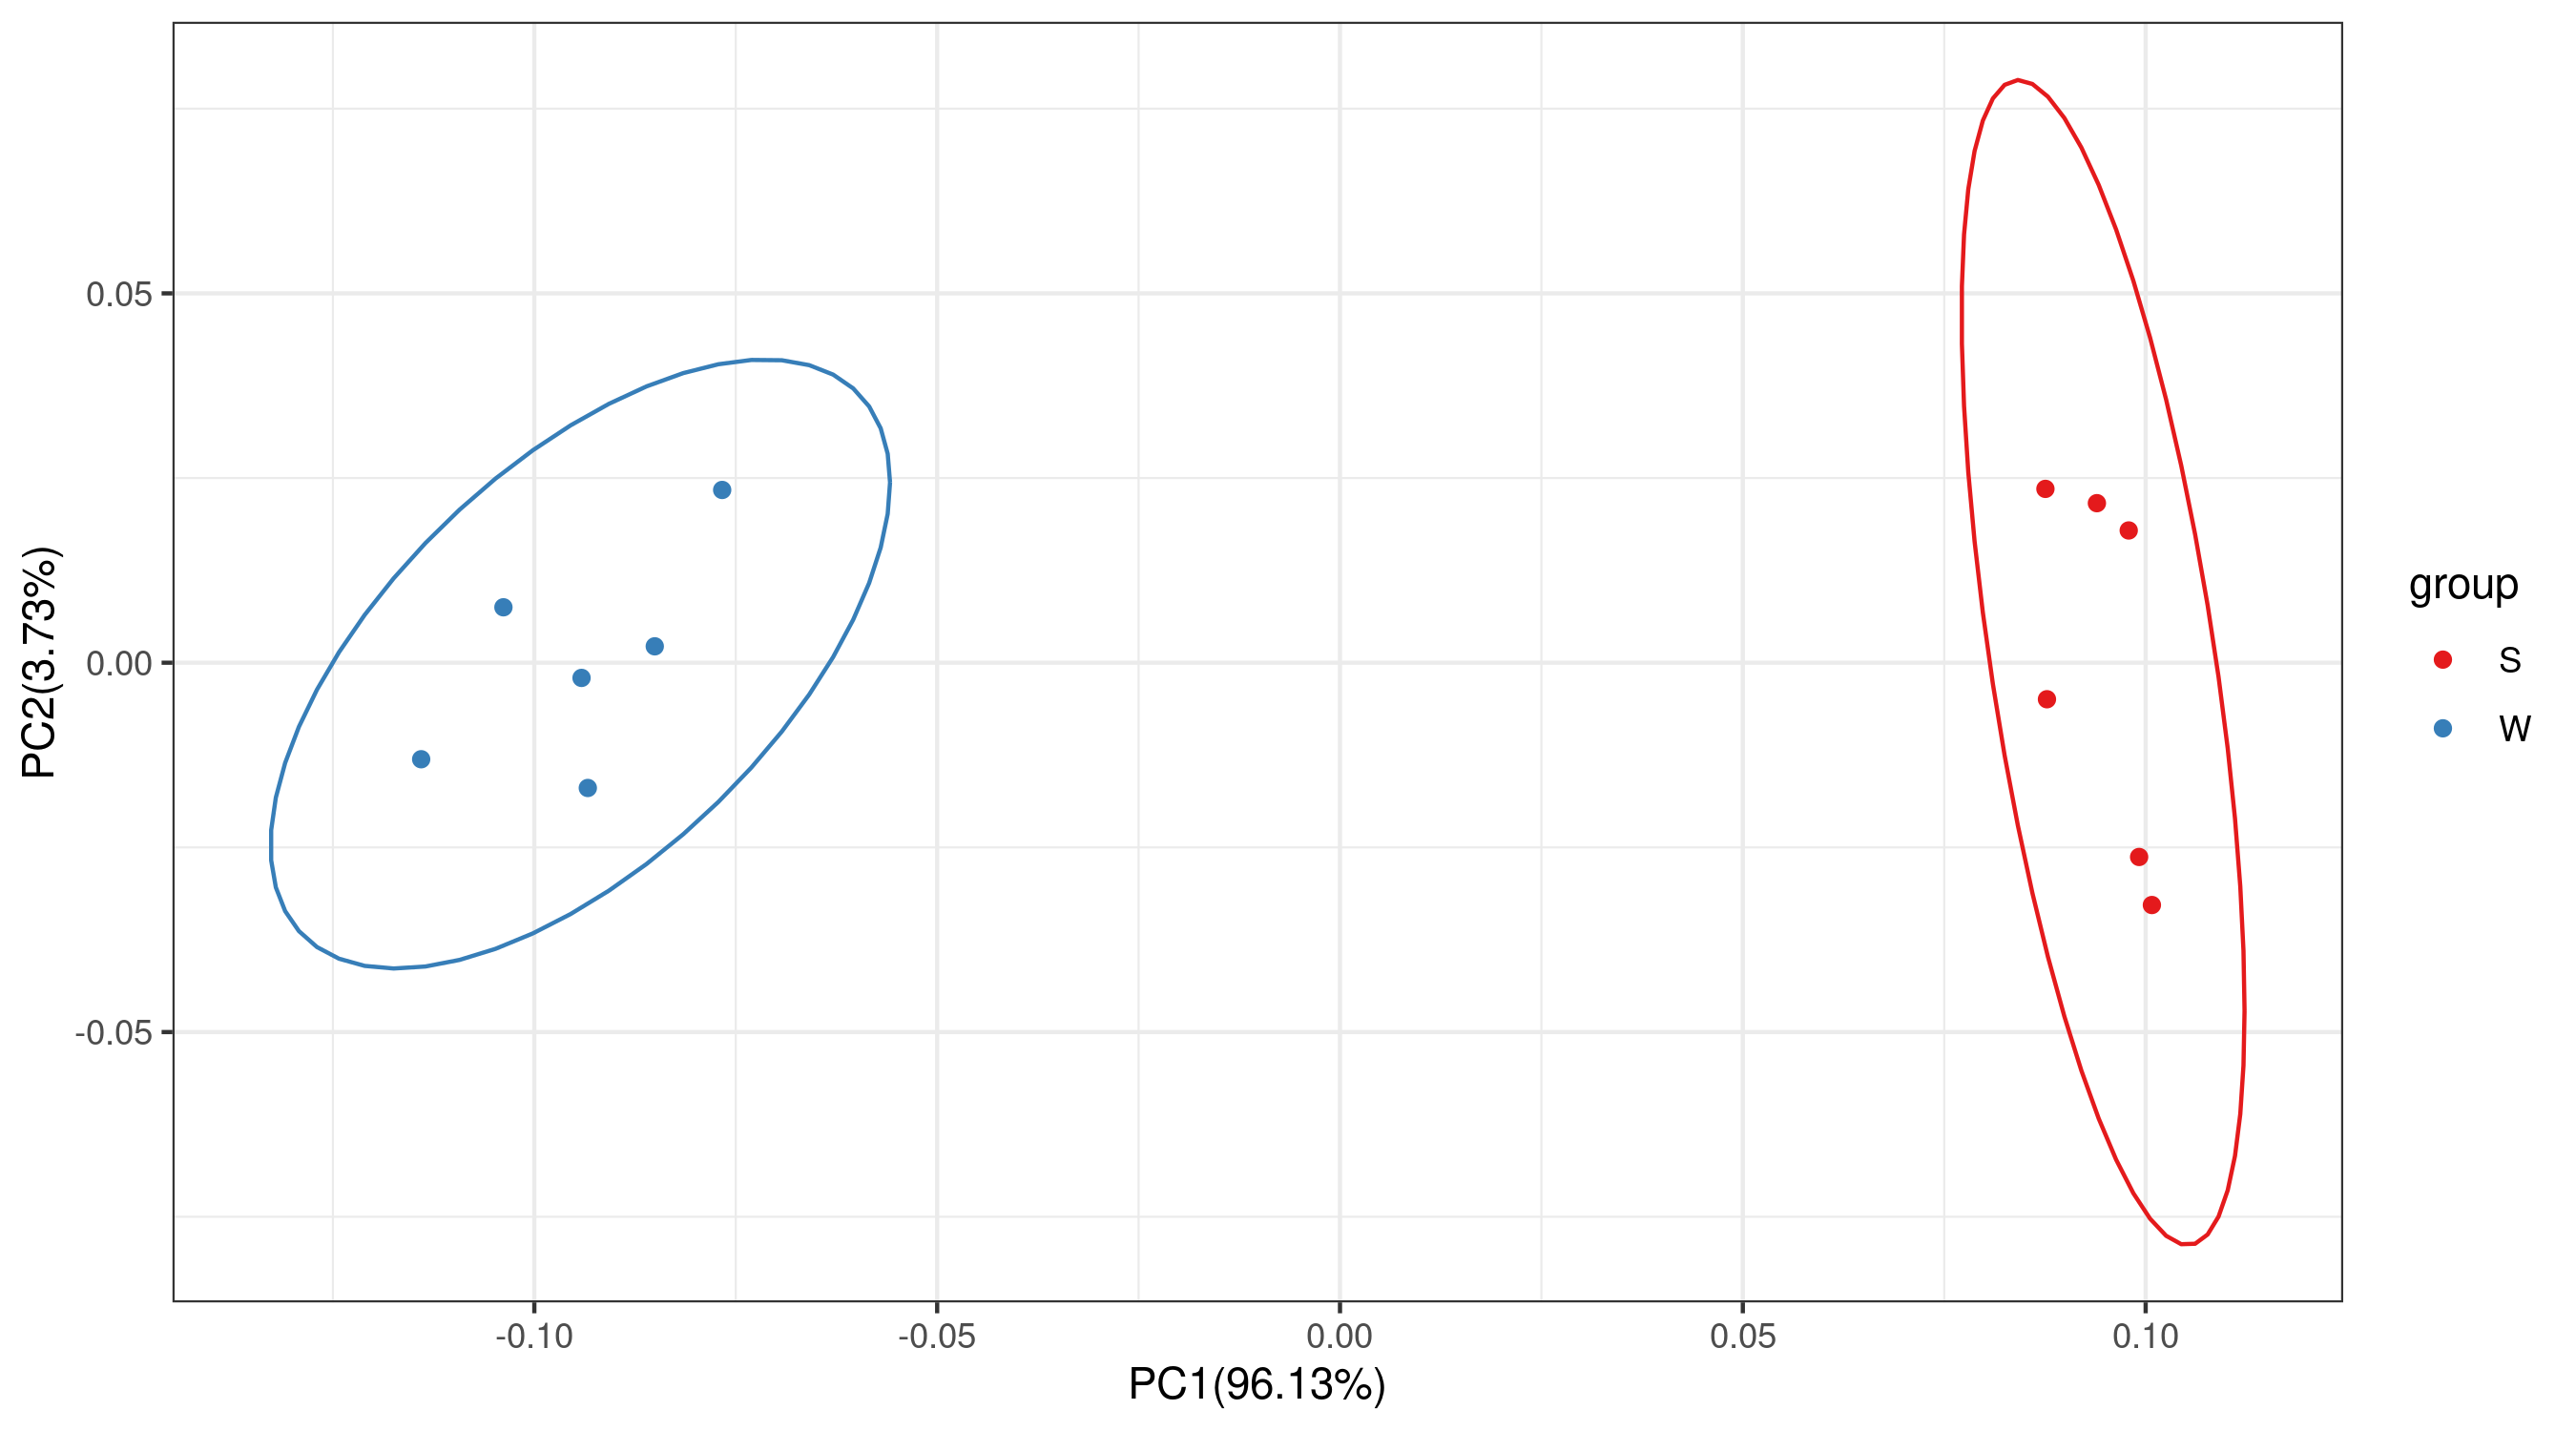
Ordinations Analysis
The gene protein sequences entered by the user are aligned with the Pfam-A.hmm data, and then the alignment results are visualized based on the R package drawProteins.
|
1. [ Required ] Paste the file: Note: paste part only support TAB-delimited content as in the example file.It is worth noting that the input file must require column names |
|---|
|
1. [ Required ] : Note: only supports csv, xls, xlsx, txt ( TAB-delimited ) as in the example file, and does not support unicode type files. It is worth noting that the input file must require column names |
|---|
2. Main parameters:
Data configuration
[ Attention ] If the input data has grouping information, the grouping column name must be selected
Note: If the input data has no grouping information, please select the '--- NULL ---' option.
Standardized settings:
Analytical method:
Ordinations specific methods:
Method distance settings:
Confidence ellipse:
The type of ellipse
The level at which to draw an ellipse
Prioritize the use of corrected eigenvalues:
Correction method:
Classic Statistical Analysis
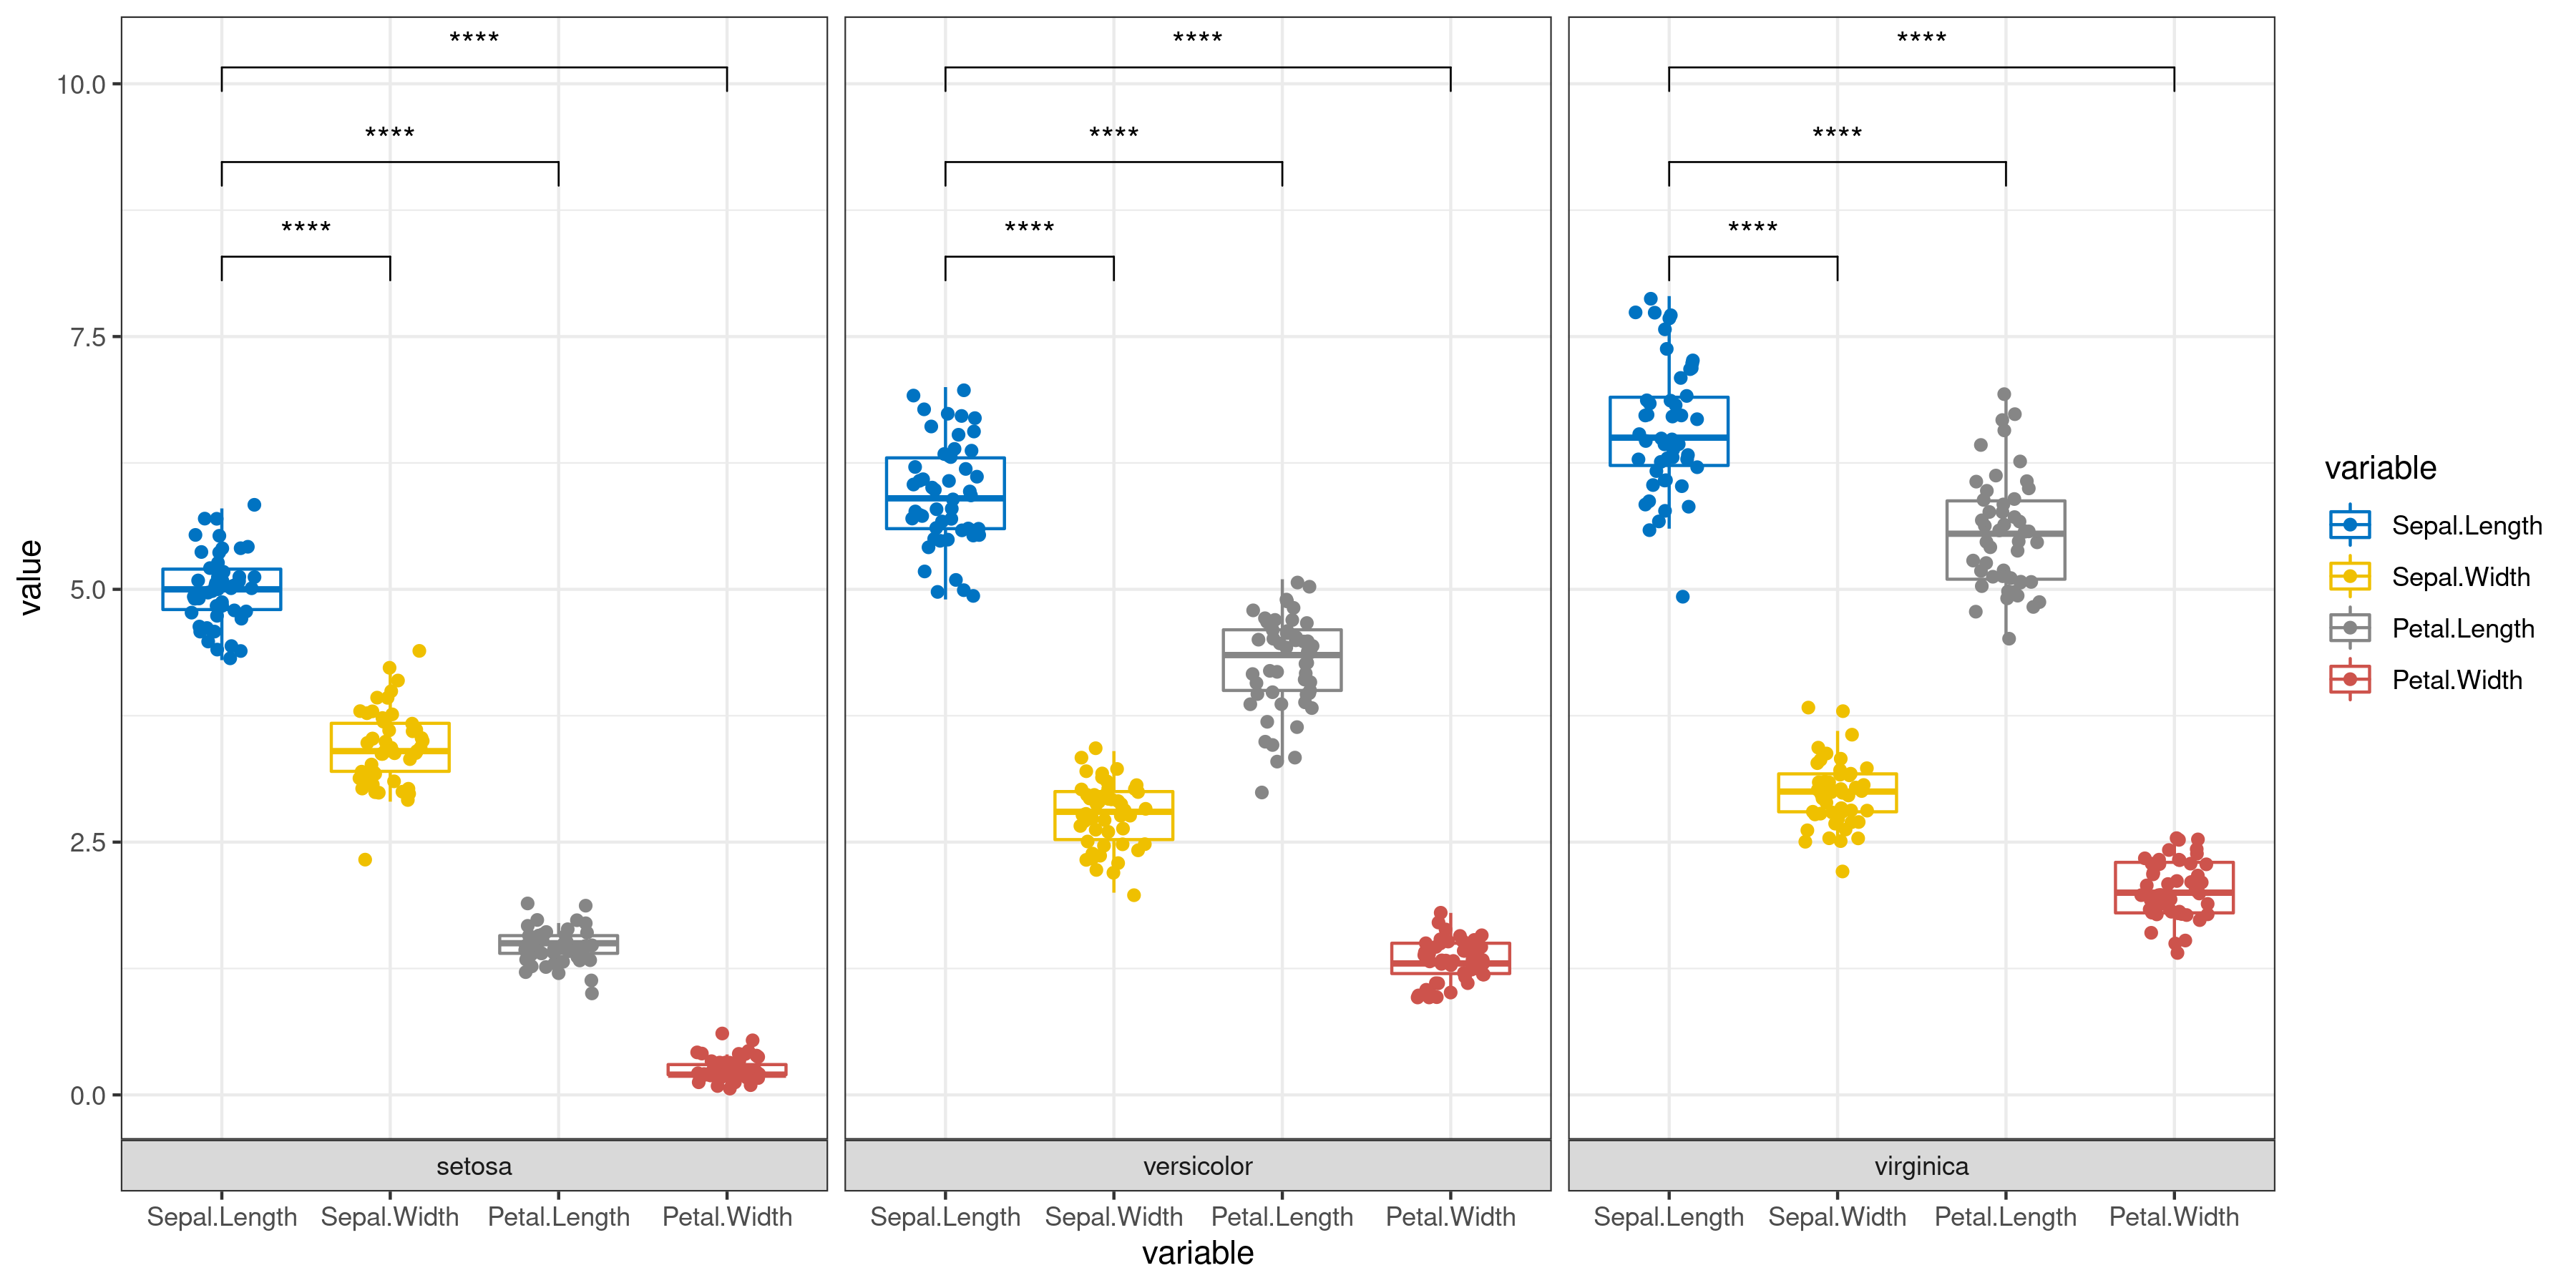
The user only needs to enter the data and simply select whether to add error bars and perform significance analysis to automatically get a graph (bar or box plot) with error bars and significance markers. Of course, the user can also specify which groups are to be subjected to the statistical test from the beginning step by step.
|
1. [ Required ] Paste the file: Note: paste part only support TAB-delimited content as in the Bar plot (mean) or Bar plot of multiple groups (mean). It is worth noting that the input file must require column names. |
|---|
|
1. [ Required ] : Note: support csv,xls,xlsx ,txt(only separated by tab),not support unicode file! example file( Dar graph of mean) or example file(draw bar charts). It is worth noting that the input file must require column names. |
|---|
2. Main parameters:
Data configuration
[ Required ] Group column name:
Bar type:
Subgroup name:
Group mapping colour:
Add error bar:
Comparisons between groups:
- [1]: Select the "Function" module in the fine adjustment module, then click the "Sign text" adjustment button, and enter the group name to be compared in the "Comparisons" input box separated by ",".
The p-value is replaced by an asterisk:
Statistical method
The interval between different sets of different labels:
Line size:
Textsize:
Bubble Chart
The bubble chart part gives the user a greater degree of freedom. The user can choose the data type displayed on the x/y axis and set the data column mapped into point size, point continuous/category color.
|
1. [ Required ] Paste the file: Note: paste part only support TAB-delimited content as in the example file. |
|---|
|
1. [ Required ] : Note: support csv,xls,xlsx ,txt(only separated by tab),not support unicode file! example file. It is worth noting that the input file must require column names |
|---|
2. Main parameters:
X-axis data column name
and x-axis data type
Y-axis data column name
and y-axis data type
The final rendered point-sized column is named
The column finally rendered as point color is named
and data type
Volcano map
The volcano plot uses the difference analysis result file. The user can either specify the up-down marker as a list, or re-limit the log2FoldChange and pvalue to determine the up-down marker.
|
1. [ Required ] Paste the file: Note: paste part only support TAB-delimited content as in the example file. |
|---|
|
1. [ Required ] : Note: support csv,xls,xlsx ,txt(only separated by tab),not support unicode file! example file. It is worth noting that the input file must require column names |
|---|
2. Main parameters:
Use newly specified parameters to determine up-down categories :
Up and down grouping category column names
Genes with a adjusted P value less than
The absolute value of the fold change (log2-transformed) greater than
Set Intersections Diagram
Considering that Venn diagrams cannot visually show the intersection between data when the number of groups is large, we use an UpSet plot to show the interaction between more groups. It is worth mentioning that in this part we use the drawing methods of UpSetR and ggven. Users can choose Venn diagrams when the number of set is small, and upset diagrams when there are many sets.
|
1. [ Required ] Paste the file: Note: paste part only support TAB-delimited content as in the example file. |
|---|
|
1. [ Required ] : Note: support csv,xls,xlsx ,txt(only separated by tab),not support unicode file! example file. It is worth noting that the input file must require column names |
|---|
2. Main parameters:
Choose different plot methods:
[ Required ] Group column name:
Mb.ratio (bottom/top):
Order by:
Number angles:
Point size:
Line size:
X axis title:
Y axis title:
Height:
Width:
DPI:
(Note: this line parameter does not apply to vector graphics)
Show elements:
Elements sep:
Show percentage:
Persentage text digits:
Garden edge color:
Alpha:
Size:
Linetype:
Set name color:
Size:
Text color:
Size:
Heatmap Drawing
Considering the complexity of heatmap debugging, the visual omics tool provides two drawing methods, one is based on the pheatmap package, and the other is based on the ggplot2 package. The former is simple and beautiful, and the latter can be finely adjusted.
|
1. [ Required ] Upload the file for gene epression information: Note: paste part only support TAB-delimited content as in the example file. |
|---|
|
2. [ Optional ] Upload the file for group information: Note: paste part only support TAB-delimited content as in the example file. |
|
1. [ Required ] Upload the file for gene epression information: Note: only supports csv, xls, xlsx, txt ( TAB-delimited ) as in the example file, and does not support unicode type files. |
|---|
|
2. [ Optional ] Upload the file for group information: Note: only supports csv, xls, xlsx, txt ( TAB-delimited ) as in the example file, and does not support unicode type files. |
3. Main parameters:
Choose different plot methods:
Add sample group:
Data transform:
Add hclust on sample and gene:
Hclust two important parameter:
Show group legend:
Show number:
Picture title:
Text angle:
TextSize:
Error report the content includes all information output during operation.


