main picture 01

Introduction
Analysis process
0
Others
1

Time-series transcriptome analysis
Quick start 1. Video
This video (we strongly recommend that you watch this tutorial before using it!) vividly demonstrates the use of time-series transcriptome analysis. Considering the step-by-step nature of the tool, users can follow the video to reproduce the operation. You can also get a detailed description in the "HELP -> Usage -> Transcriptome analysis" section. The module functionality is supported by TO-GCN software and the visualization part is supported by ggraph, pheatmap software.
Quick start 2. Processing flow
There are two points that users need to pay attention to when following the arrow direction for online analysis. 1. User uploading data and selecting built-in data are optional. Users can only upload or select single source data or both. 2. Batch effect removal is also optional (in fact, it is common sense that data removal from different sources fails), and users can make judgments based on the actual situation of the data.
Feature. Rich built-in data
We provide online transcriptome analysis supported by omics data. Users can combine FishCODE's rich built-in omics data with their own data to perform high-degree of freedom merge analysis. These omics data covering a wide range of experimental conditions can also be freely explored individually.
Feature 2. Image modification
FishCODE's visualization of transcriptomic results is mainly supported by Visual Omics (our team's early development software, a web-based platform for omics data analysis and visualization with rich graph-tuning capabilities), so the result picture analyzed here supports the fine adjustment of all 260 parameters of visual omics and the adjustment behavior of additive modification and working picture switching.
The adjustment panel will be automatically cleared When the user switches between different types of pictures for fine adjustment:
The adjustment panel will be automatically cleared When the fine-tuning button is clicked each time:
Time-series transcriptome analysis
Q: Improper operation tips ?
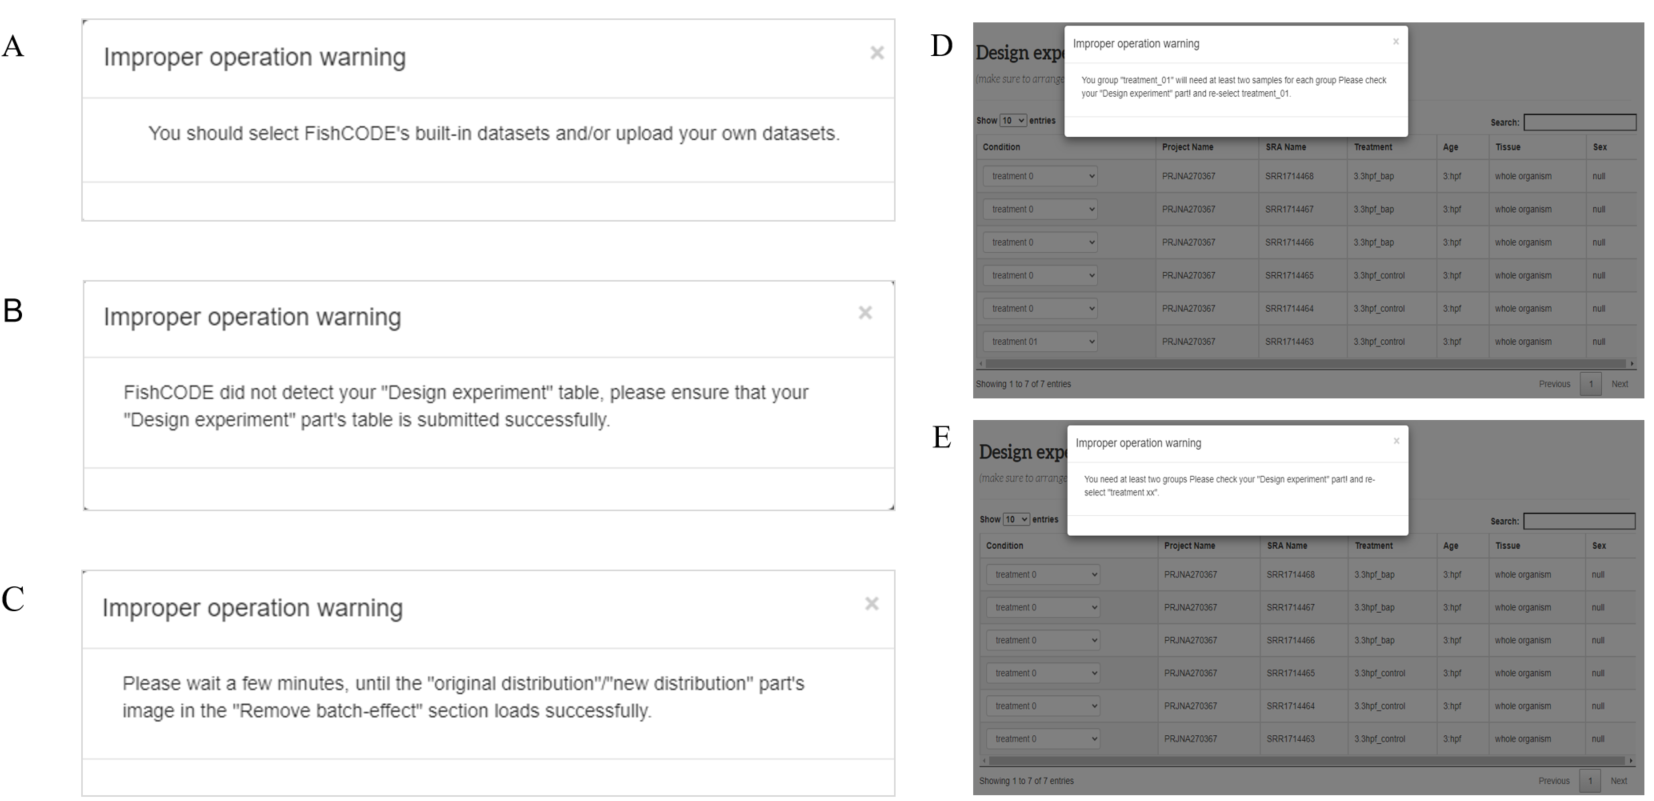
A. This means that FishCODE did not detect the required user input or/and built-in data. B. This means that FishCODE did not detect that you uploaded a suitable experimental design form (“Design experiment” part) C. This means that FishCODE did not detect the end of the "original distribution/new distribution" run. This may be because the PCA analysis or batch effect removal has not yet ended, or has not started. D-E. This means that FishCODE detects that the table in your "Design experiment" section is not sufficient (2 * 2), at least two groups and each group must have at least two samples.
Q: Why does the joint analysis of the data I uploaded and the transcriptome of the corresponding species fail?
The most likely problem with this situation is that the genome annotation versions used by the two parties are not the same. If joint analysis is required, the annotation version specified with FishCODE must be used for early counting. For related genome and annotation versions, please refer to the "HELP -> Gene Search -> Genomes and annotations". The early transcriptome counting pipeline can be found in "OTHER TOOLS -> Omics preprocessing -> Transcriptome upstream script"
Q: How to adjust selected built-in omics samples in the "Choose data" part
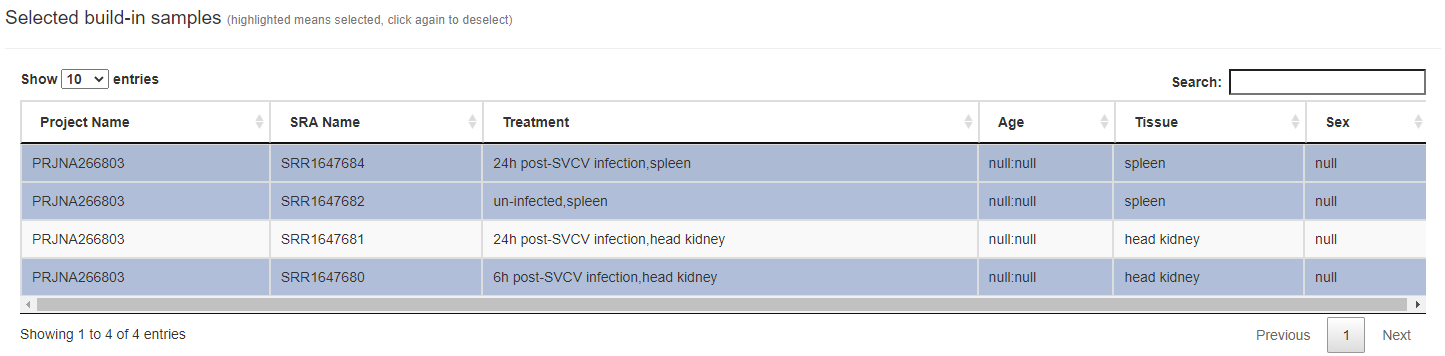
To put it simply, the user only needs to click the highlighted sample row again (on the "Choose built-in data" -> "Selected build-in samples") to cancel the highlighting. All unhighlighted sample rows will not be counted in the subsequent data analysis. As shown in the picture above, only the highlighted "SRR1647684", "SRR1647682", and "SRR1647680" will be analyzed.
Q: Why did I choose the Combat method to remove the batch effect, and PCA failed?
FishCODE uses Combat_seq to help users remove batch effects between data sets from different sources. However, combat_seq requires parameters such as original data variance and cannot guarantee complete success. Moreover, this function takes a long time to run when the amount of data is large. If you observe obvious batch effects on the PCA plot of the original distribution, you can try other methods provided by FishCODE to remove the batch effects.
Q: After I removed batch effects, I was not satisfied with the results. How can I use the original data for added analysis?
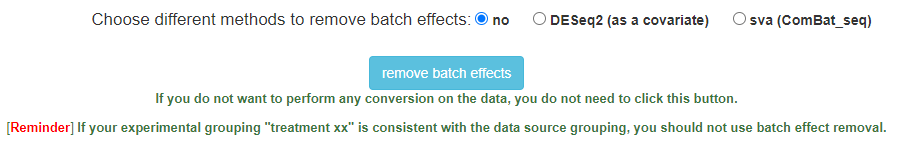
This is an easily overlooked problem. You can click the button after setting the parameters as shown in the figure below and wait for the operation to end.
Q: How to effectively respond to errors encountered during use
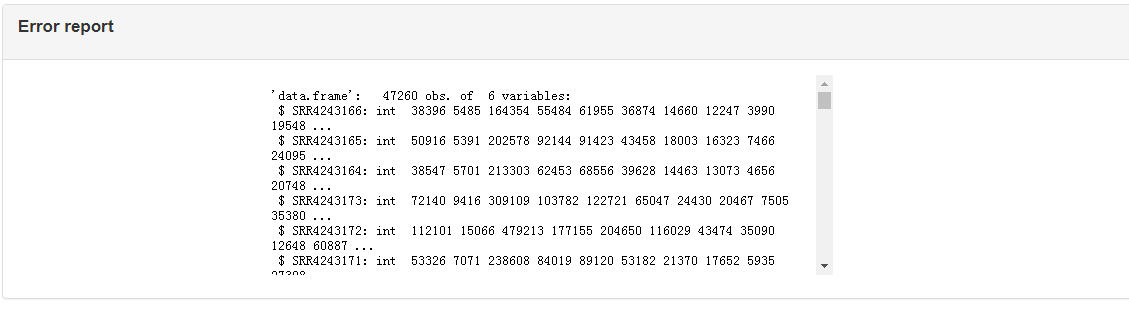
There is an "err report" module at the bottom of the right side of "Results and Display" (as shown in the picture above). You can attach the content of the err report to the consultation email ( xqxia@ihb.ac.cn ).
Users Data [ Optional ]: If you only want to explore the built-in omics data, just click the "Go to next step" button in the lower right corner
Note: You have chosen not to upload your own data for combined analysis, which means you only want to explore the built-in data.
|
1. [ Required ] Upload the file for gene expression information: Note: paste part only support TAB-delimited file as in the example file. |
|---|
|
2. [ Required ] Upload the file for group information: Note: paste part only support TAB-delimited file as in the example file. |
0
0
0
0
0
[Required] this button should be clicked regardless of whether you upload your own data or not
Choose data
(you can choose built-in data or upload your own data, or both for joint analysis. for detailed operation, please watch this video)
Build-in datasets
Selectors (help users quickly find interesting data sets, select target species -> select experimental conditions of interest -> target data set)
Build-in datasets information (click on a row of items of interest)
Build-in sample Information (click on any sample row to mark it as selected (highlighted) and ready to enter the next step of analysis (click again to cancel the highlight))

Note: Only highlighted lines will be added.
Selected build-in samples (highlighted means selected, click again to deselect)
User's own datasets (if you choose to upload your own data and merge it with the built-in data for analysis, the following two files must be uploaded)
|
1. [ Required ] Upload the file for gene epression information: Note: only supports csv, xls, xlsx, txt ( TAB-delimited ) as in the example file (Danio rerio, this sample file does not apply to other species), and does not support unicode type files. |
|---|
|
2. [ Required ] Upload the file for group information: Note: only supports csv, xls, xlsx, txt ( TAB-delimited ) as in the example file, and does not support unicode type files. |
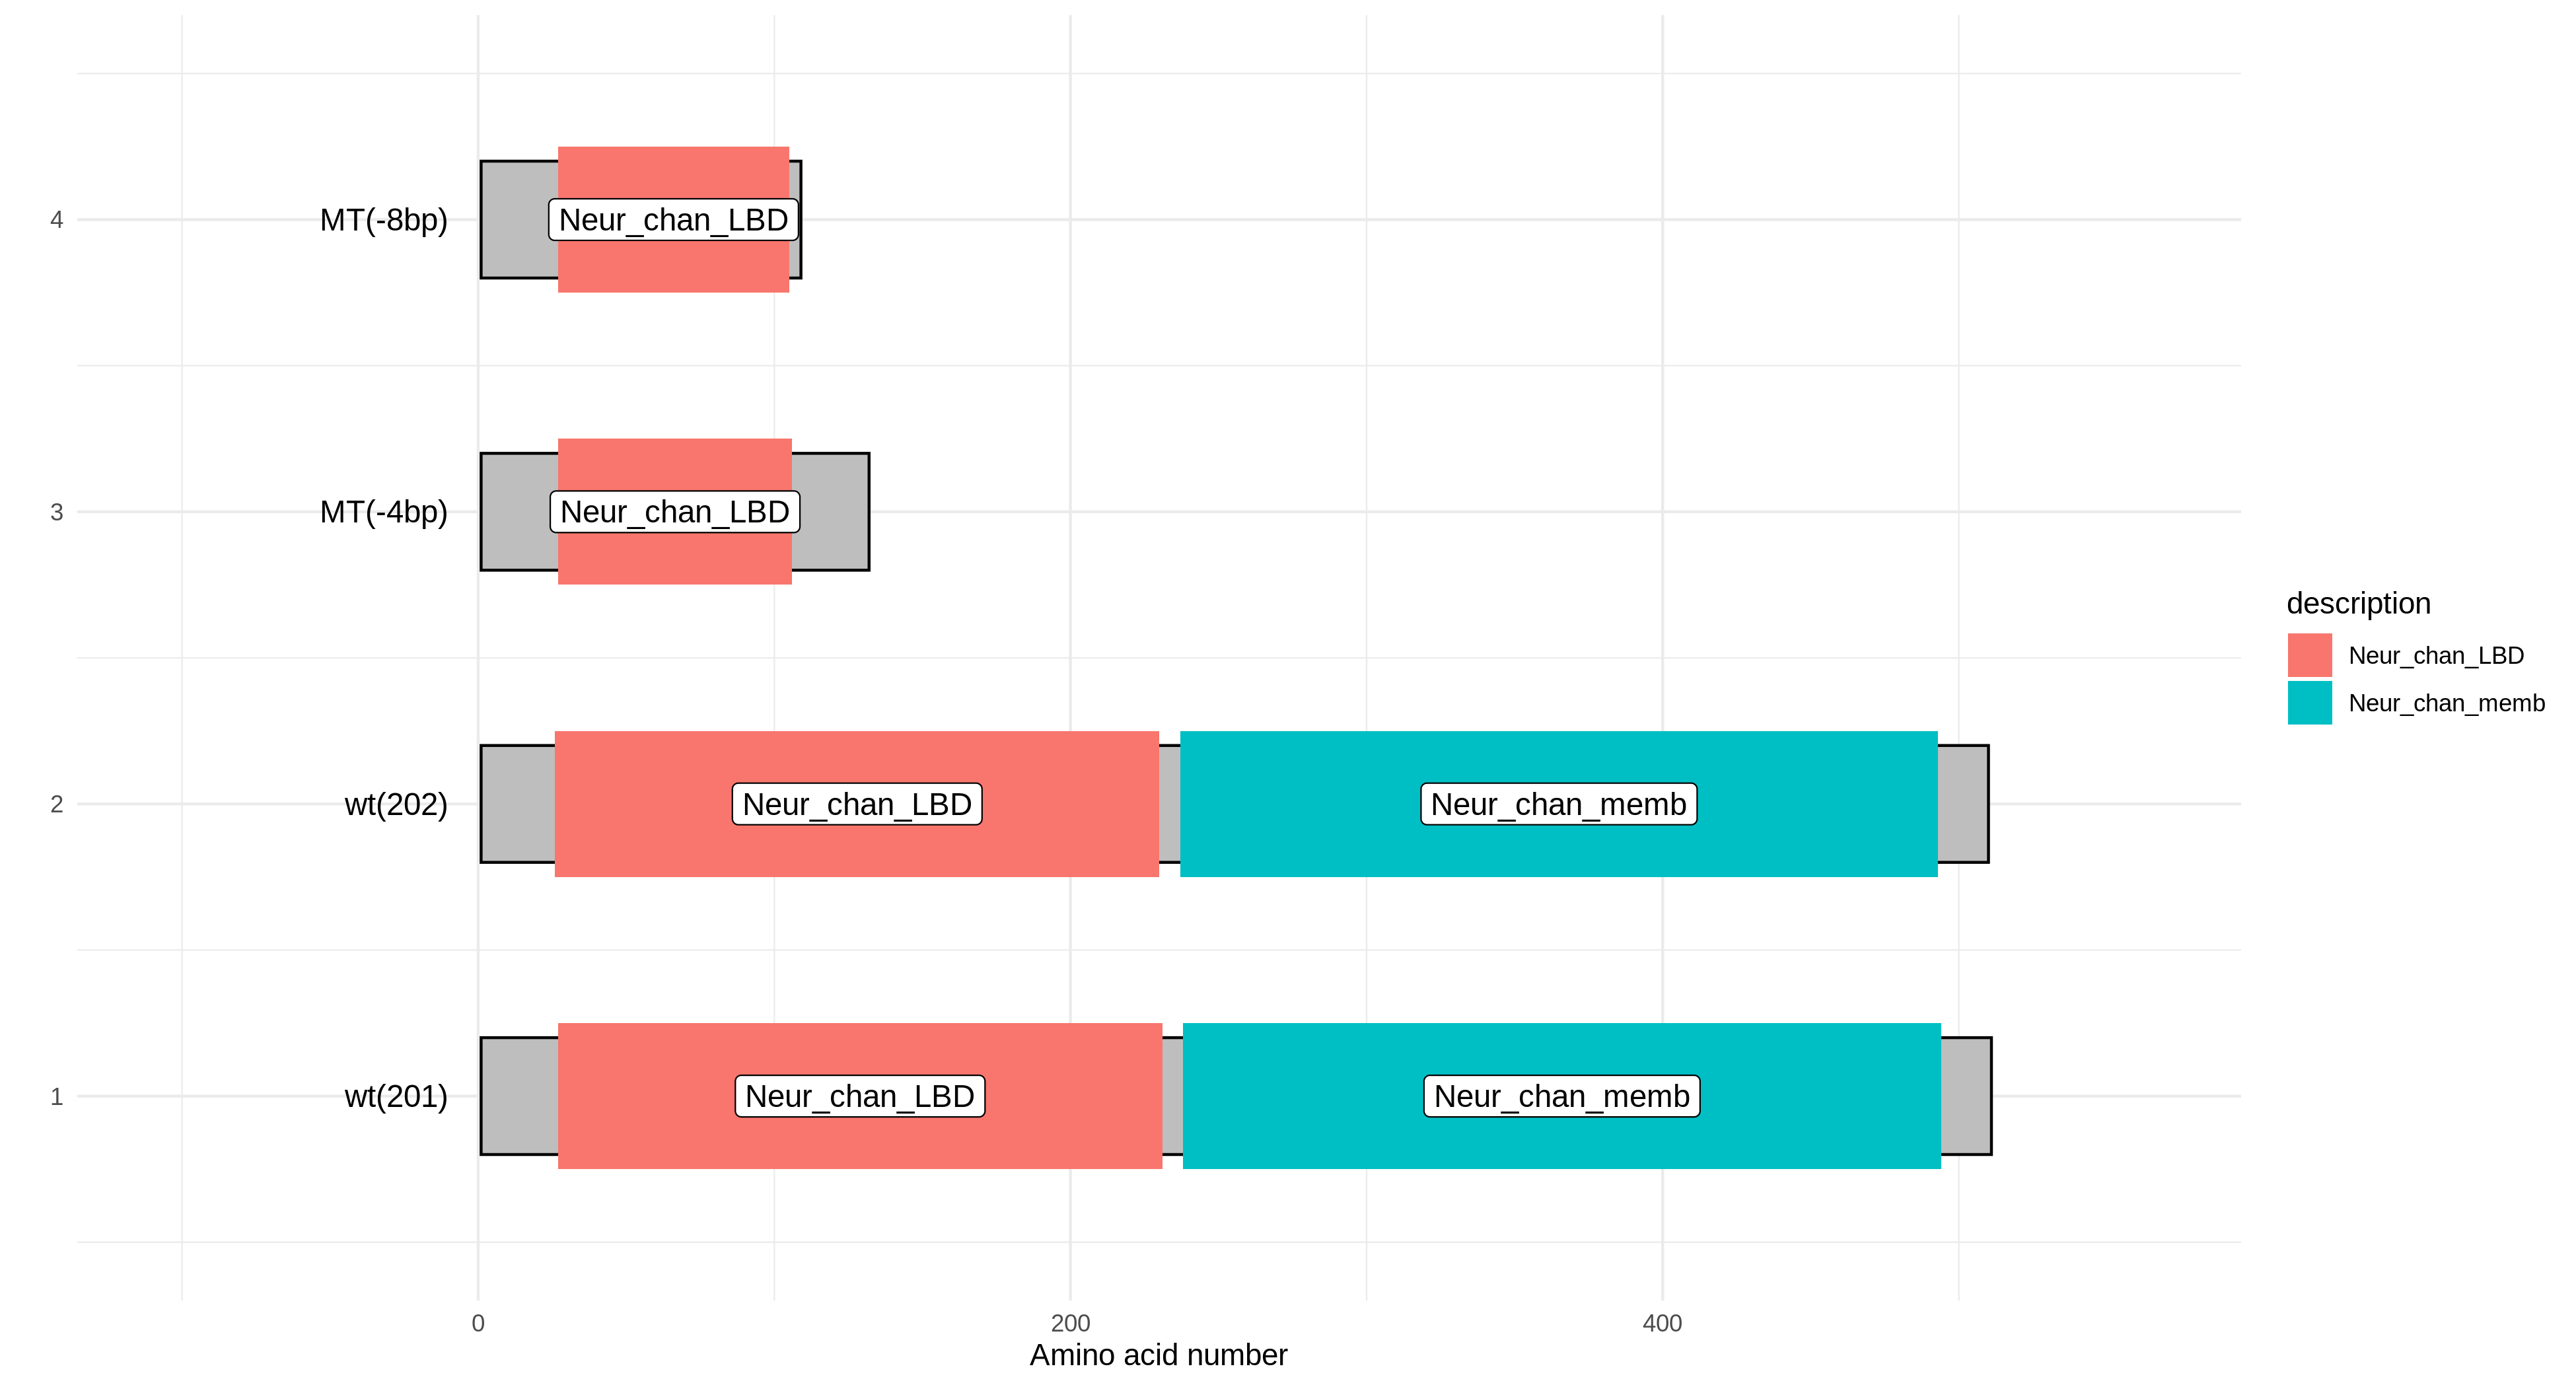
Protein Domain Prediction
The gene protein sequences entered by the user are aligned with the Pfam-A.hmm data, and then the alignment results are visualized based on the R package drawProteins.
|
1. [Required] Paste the file which like fasta file: Note: only supports fasta type file as in the example file. |
|---|
|
1. [ Required ] which contain colnum gene symbol or NCBI or Ensembl ID: Note: only supports fasta type file as in the example file, and does not support unicode type files. |
|---|
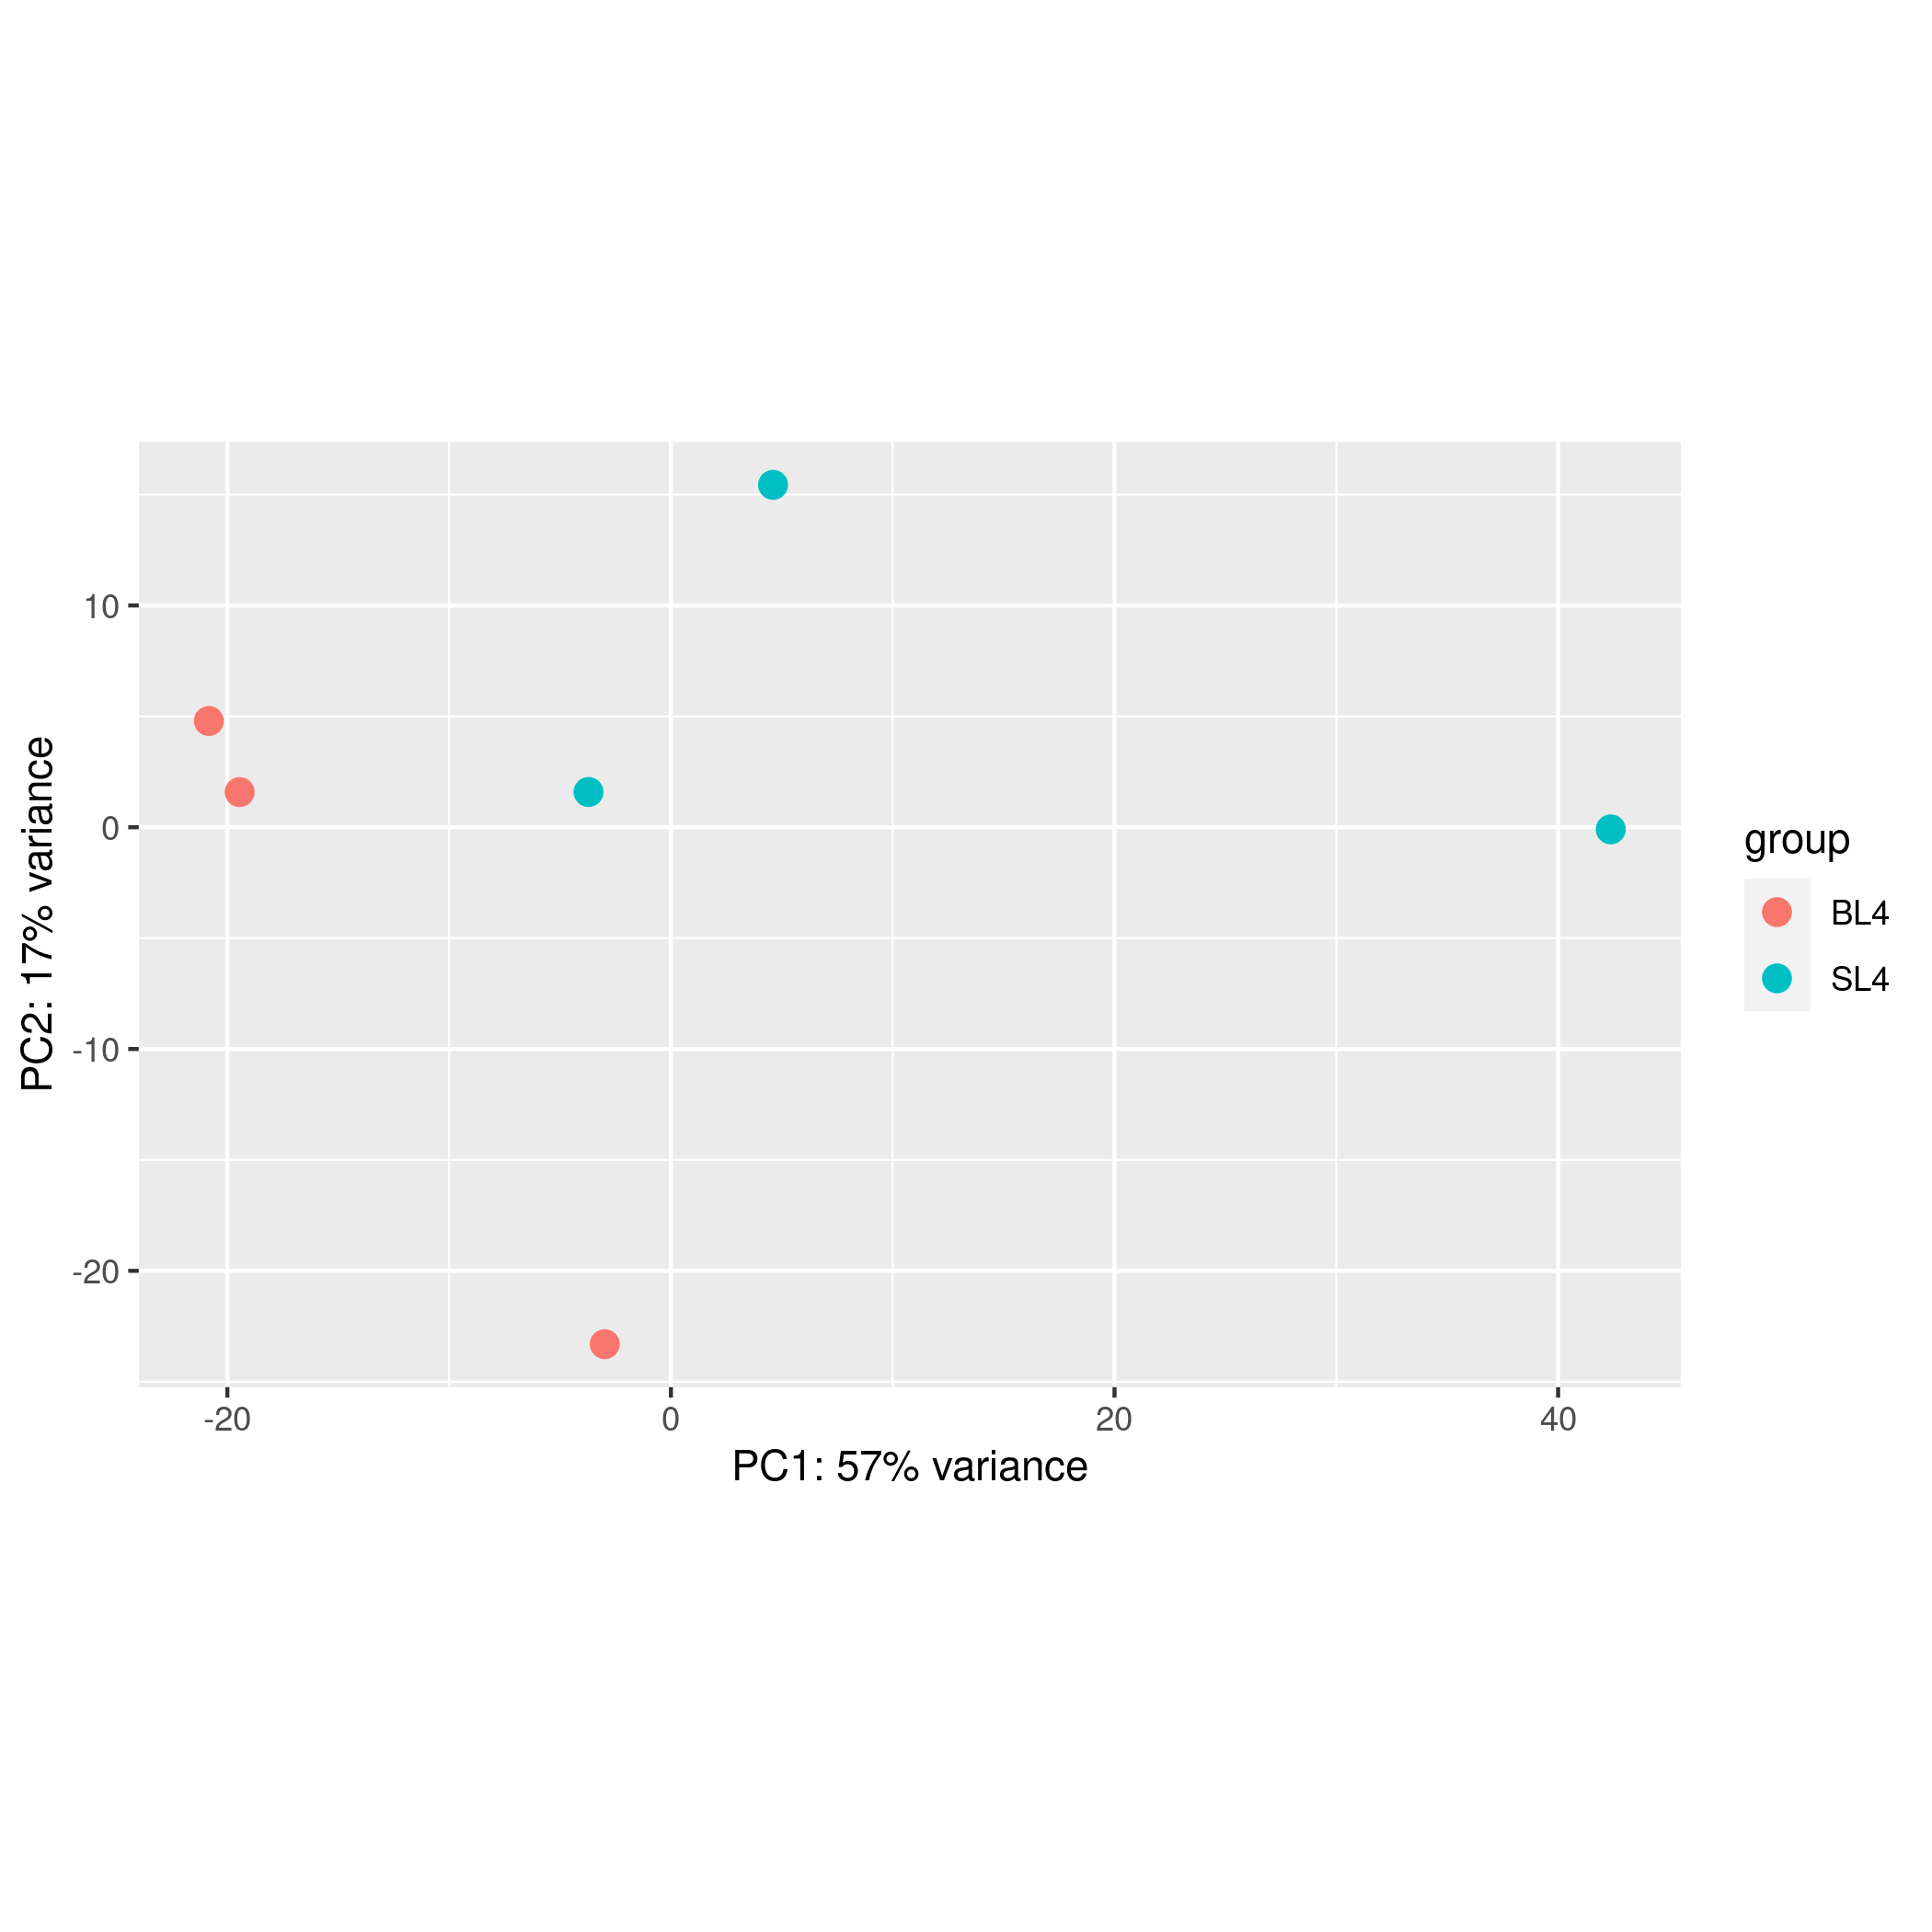
Remove batch effects
(if your data's original distribution meets your needs, just click the "Go to the next step" button, for detailed operation, please watch this video)
original distribution (PCA distribution plot of the merged data set without any data transformation)

Choose different methods to remove batch effects:
If you do not want to perform any conversion on the data, you do not need to click this button.
[Reminder] If your experimental grouping "treatment xx" is consistent with the data source grouping, you should not use batch effect removal.
new distribution (samples PCA image after data processing. the following analysis will be based on your converted data)
0
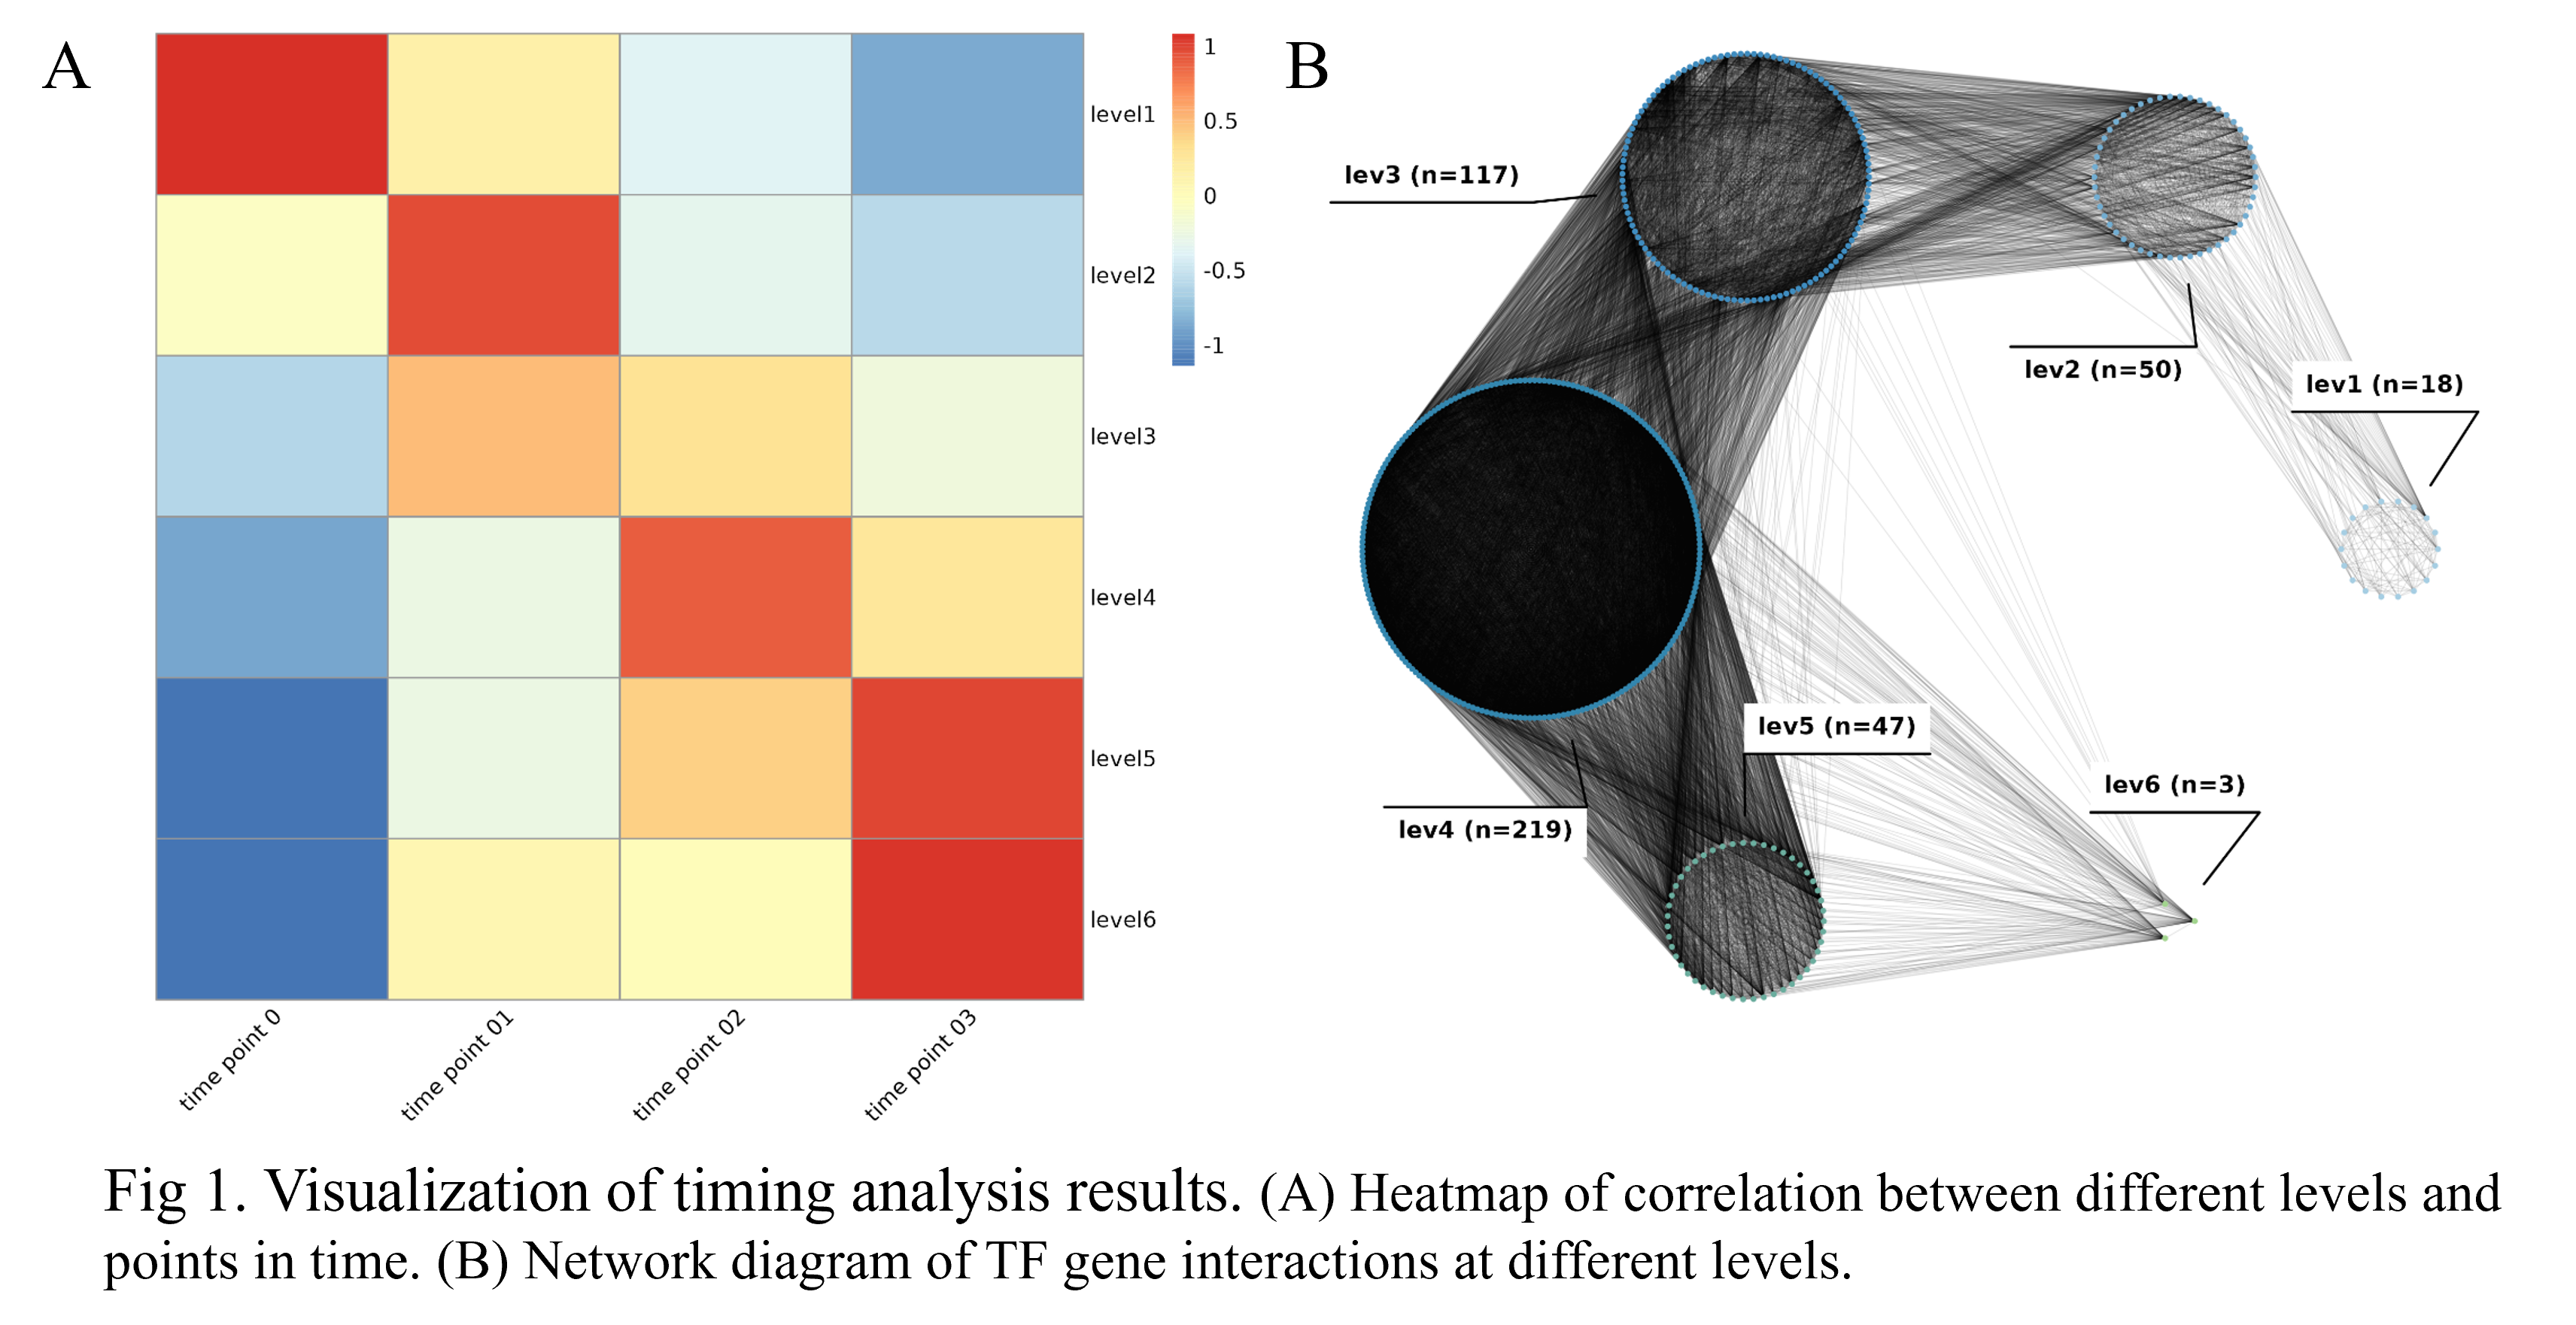
Analysis results and visualization
The output of the analysis consists of a downloadable results file and an online table (grouping of genes at different levels). The entire process typically takes 2 to 5 minutes, depending on the number of samples.
Featured operating tips
- The analysis results include an online list of grouping information for the different levels at which the genes are located. Clicking on a line will jump to the page of the gene. video.
- You can upload the results file to "Visual Omics" (part of FishCODE, an online tool that supports multiple omics analyzes) for more corresponding analysis function. See this video for details.
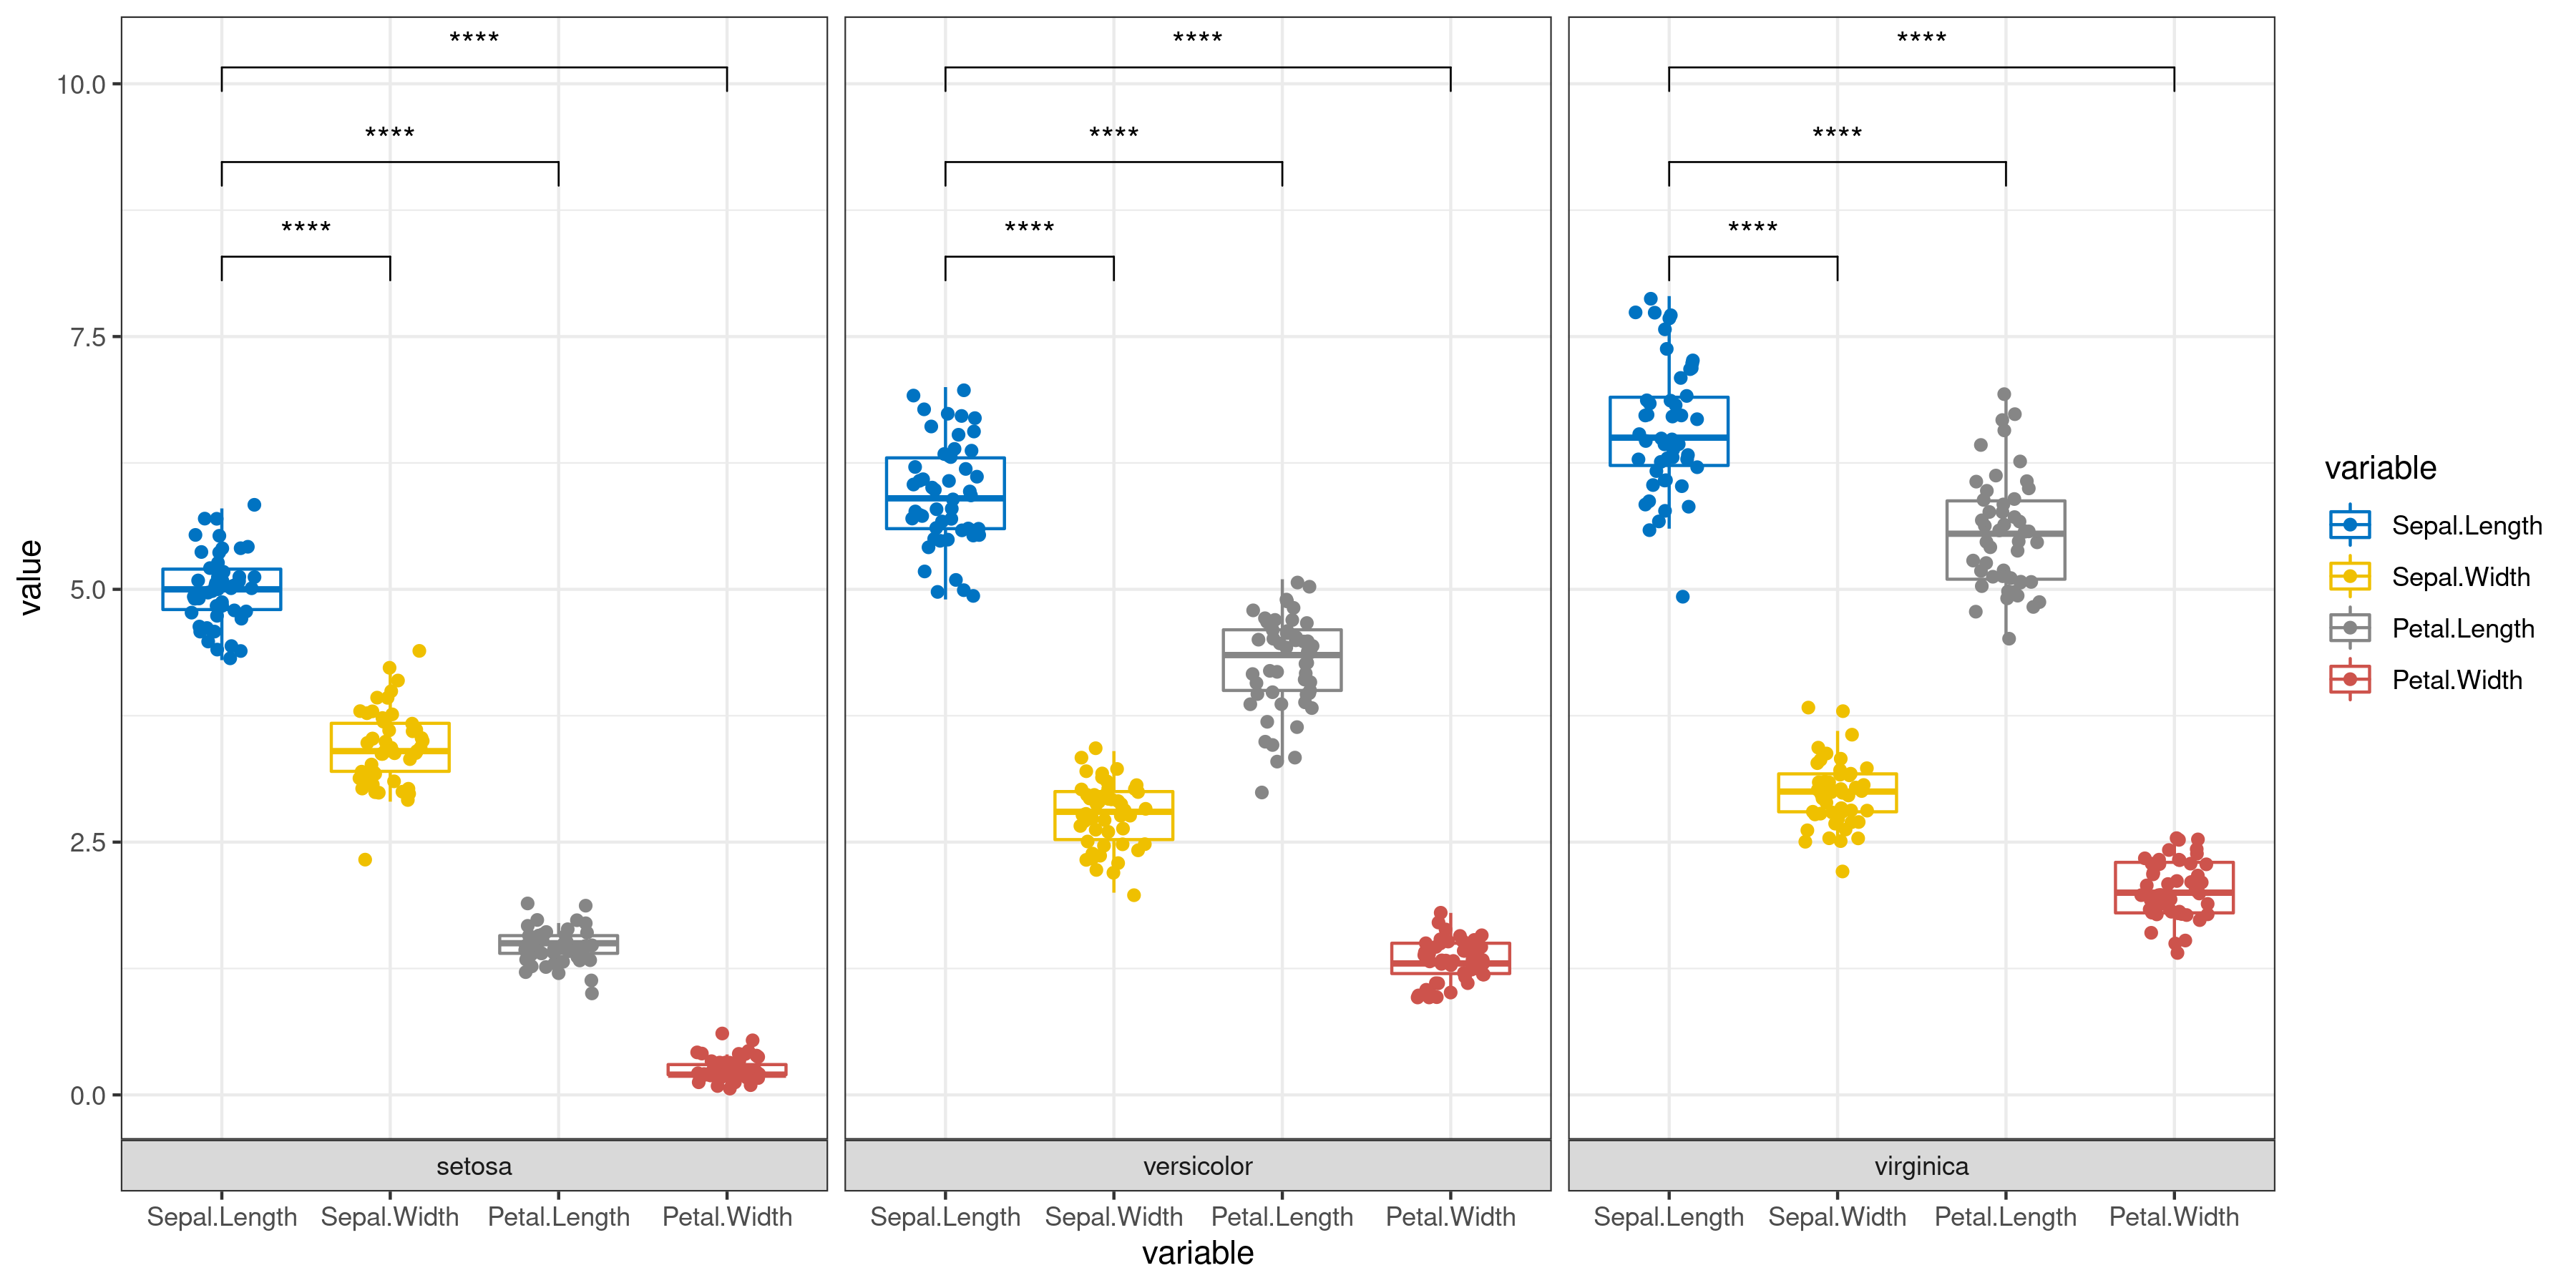
Classic Statistical Analysis
The user only needs to enter the data and simply select whether to add error bars and perform significance analysis to automatically get a graph (bar or box plot) with error bars and significance markers. Of course, the user can also specify which groups are to be subjected to the statistical test from the beginning step by step.

|
1. [ Required ] Paste the file: Note: paste part only support TAB-delimited file as in the example file( Dar graph of mean) or example file( draw bar charts ). It is worth noting that the input file must require column names |
|---|
|
1. [ Required ] : Note: support csv,xls,xlsx ,txt(only separated by tab),not support unicode file! example file( Dar graph of mean) or example file(draw bar charts). It is worth noting that the input file must require column names |
|---|
2. Main parameters:
Data configuration
[ Required ] Group column name:
Bar type:
Subgroup name:
Group mapping colour:
Add err bar:
Add all Significance markers:
- 1: If you want to personalize the add error line, select No and then add it manually inside the detail plot
The p-value is replaced by an asterisk:
Statistical method
The interval between different sets of different labels:
Line size:
Textsize:
Analyze data
Filter low-expressed genes, at least
meet the tpm more than
.Choose genes with monotonically decreasing and tpm greater than:
as seeds
Choose the PCC (Pearson correlation coefficient) threshold between genes:
the PCC (Pearson correlation coefficient) threshold:
Selecting the layout of a network diagram
FishCODE detects that you have selected datasets from multiple species and the platform will perform cross-species transcriptome analysis for you.
Select gene symbol of
as criteria for homologous gene symbol in detected multiple species.
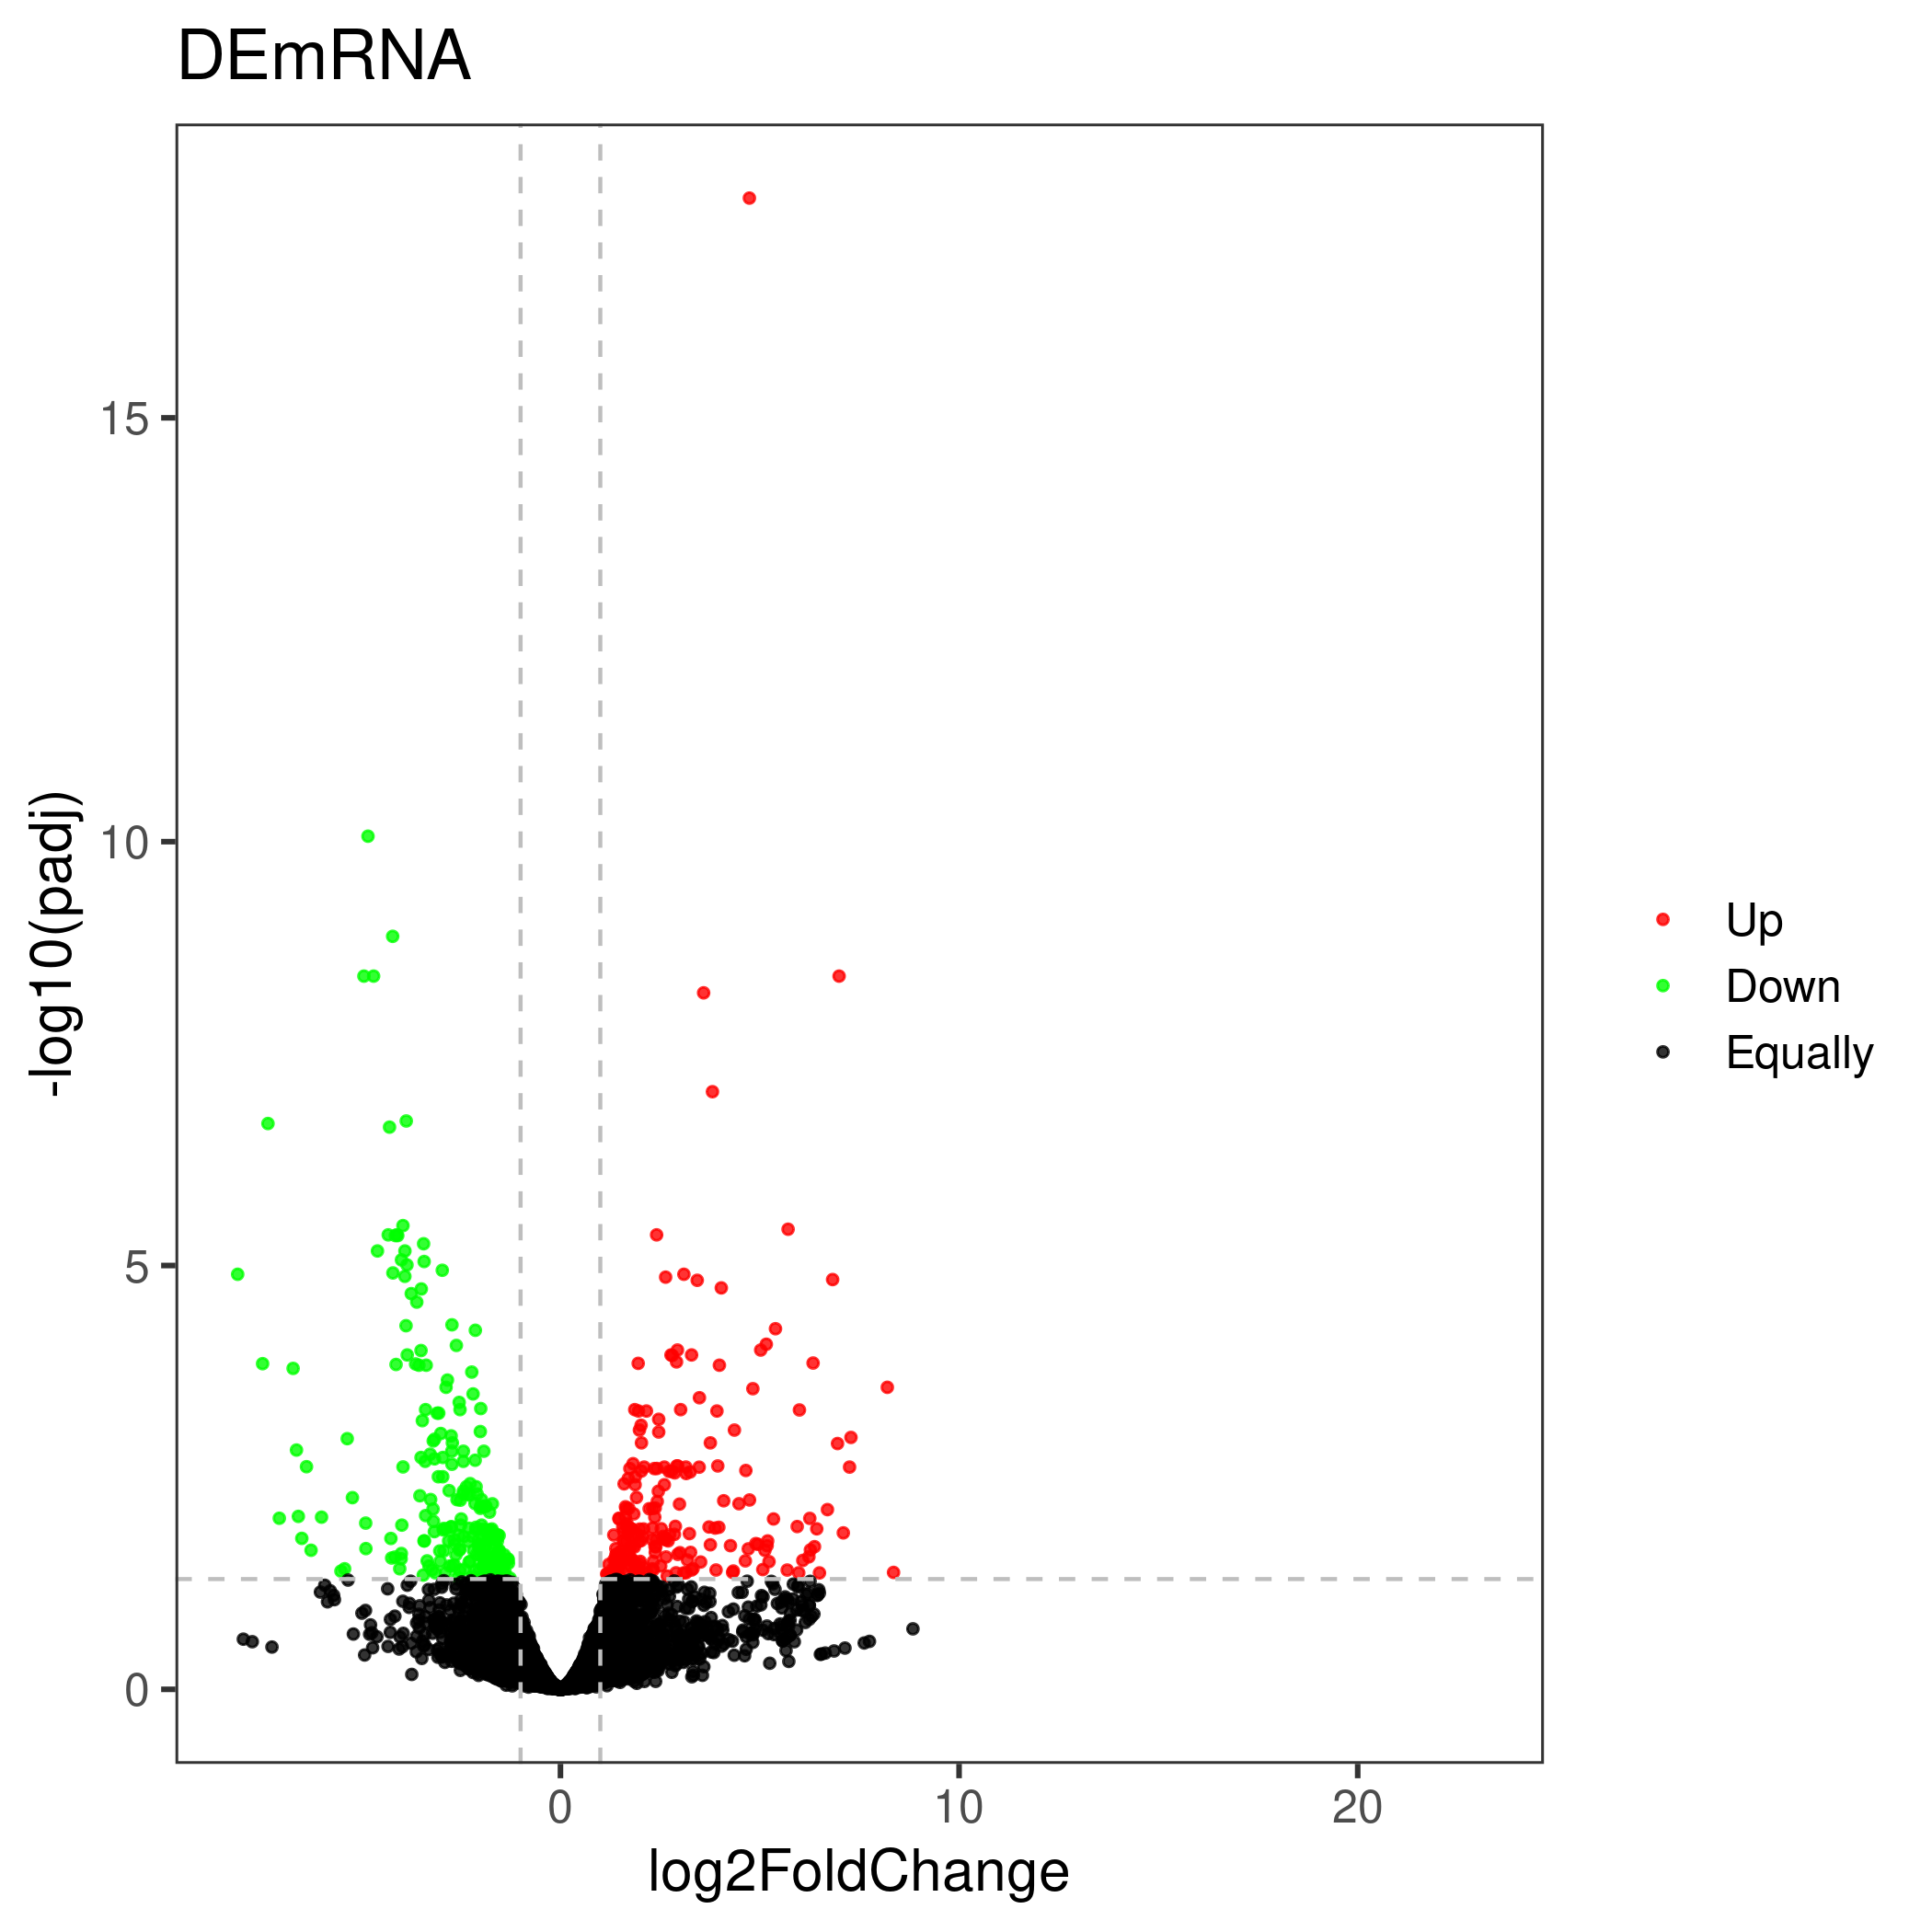
Volcano map
The volcano plot uses the difference analysis result file. The user can either specify the up-down marker as a list, or re-limit the log2FoldChange and pvalue to determine the up-down marker.
|
1. [ Required ] Paste the file: Note: paste part only support TAB-delimited file as in the example file. |
|---|
|
1. [ Required ] : Note: support csv,xls,xlsx ,txt(only separated by tab),not support unicode file! example file. It is worth noting that the input file must require column names |
|---|
2. Main parameters:
Use newly specified parameters to determine up-down categories :
Up and down grouping category column namesUp and down grouping category column names
Genes with a significance test p-value less than (padj)
and the absolute value of the fold change greater than (log2FoldChange)
Venn Diagram
Venn diagram parts are visualized using the ggvenn R package. The adjustment of the picture in the fine adjustment part is overlay, pay attention to keep the modification.
|
1. [ Required ] Paste the file: Note: paste part only support TAB-delimited file as in the example file. |
|---|
|
1. [ Required ] : Note: support csv,xls,xlsx ,txt(only separated by tab),not support unicode file! example file. It is worth noting that the input file must require column names |
|---|
2. Main parameters:
Configuration
[ Required ] Group column name:
Show elements:
. Elements sep:
Show percentage:
. Persentage text digits:
garden edge color:
alpha:
size:
linetype:
Set name color:
size:
text color:
size:
Design experiment
(make sure to arrange at least two different groups, and each group should has at least two samples, for detailed operation, please watch this video)
Auxiliary picture sreplot,biplot
0
main picture 02
FishCODE Source usage tips: clicking on a row in the list will jump to the detailed information page of the gene in the FishCODE database.
Download (you can download "Gene_list_in_each_level.txt" and input it into "Visual Omics" to perform downstream analysis such as enrichment analysis. For detailed operations, please see video)
| File name | Last modifield date | Size | Information |
|---|
Error report
de analyse:support csv,xls,xlsx ,txt(only separated by tab),not support unicode file !
input expression file : expression data
group file : group data
- Get in touch
- Li Heng, Email: liheng19@mails.ucas.ac.cn
- copyright 2021-2022
- @Institute of Hydrobiology, Chinese Academy of Sciences Lab of bioinfomation