

 Gene
Gene RNA
RNA


DISTRIBUTION OF BIOPROJECTS
The phylogenetic relationships among the ray-finned fishes in FishGET are shown in the figure below left. This 8 fishes span two different whole genome duplication events found in teleost fish. Including teleost-specific WGD event (the first red star) and salmonid-specific WGD event (the second red star).
The distribution of bioprojects in FishGET is shown in the following figure on the right. The number of bioprojects and samples of each species are shown in the stacked bar figure, and the experiment types covered by each species are shown in the pie figure.

BASIC INFORMATION OF SPECIES
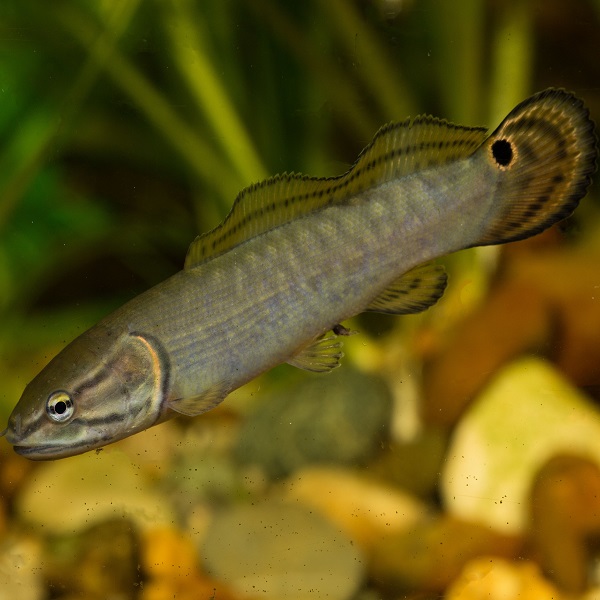
Genome version: AmiCal1
Transcriptome source:
> FishGET assembly
> NCBI(GenBank assembly)
Bioproject source: NCBI(SRA)
Classification:
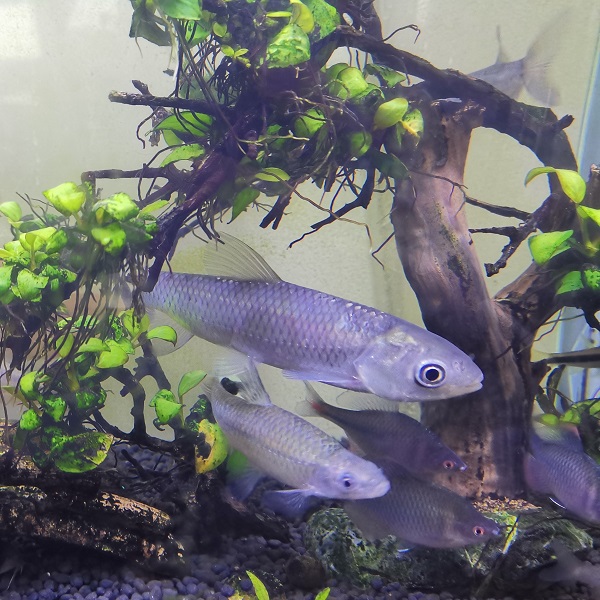
Genome version: ASM1883169v1
Transcriptome source:
> FishGET assembly
> NCBI(RefSeq assembly)
Bioproject source: NCBI(SRA)
Classification:
Genome version:
v1_2015/06_NatureGenetics
Transcriptome source:
FishGET assembly
Bioproject source:
> NCBI(SRA)
> GSA
Classification:
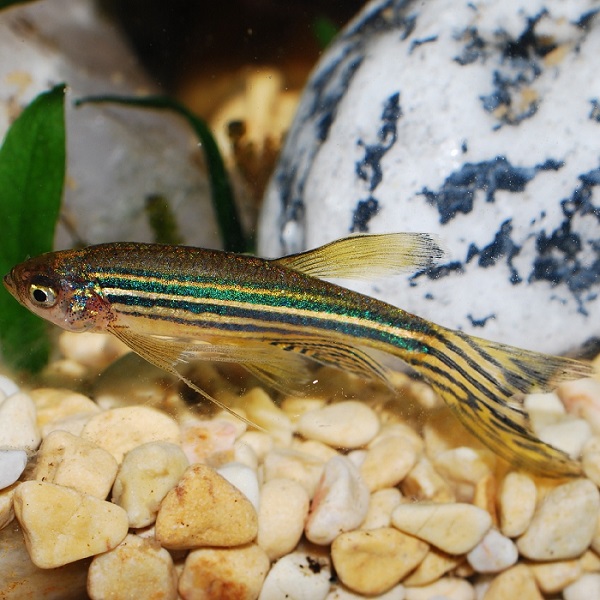
Genome version: GRCz11
Transcriptome source:
> ensembl
> LncRBase V.2
> ZFLNC
Bioproject source:
NCBI:
(PRJEB12982)
Classification:
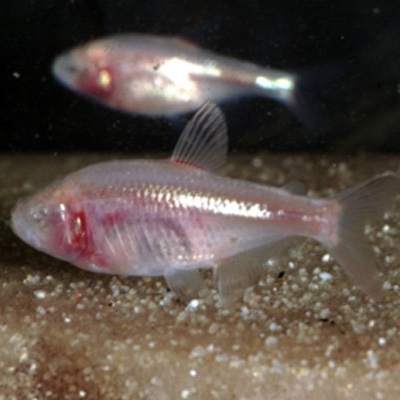
Genome version:
Astyanax_mexicanus-2.0
Transcriptome source:
> FishGET assembly
> NCBI(RefSeq assembly)
Bioproject source: NCBI(SRA)
Classification:
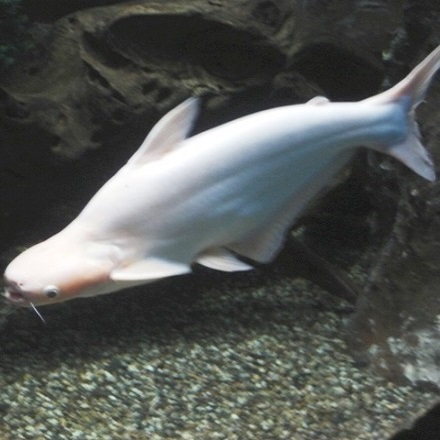
Genome version: GENO_Phyp_1.0
Transcriptome source:
> FishGET assembly
> NCBI(RefSeq assembly)
Bioproject source: NCBI(SRA)
Classification:
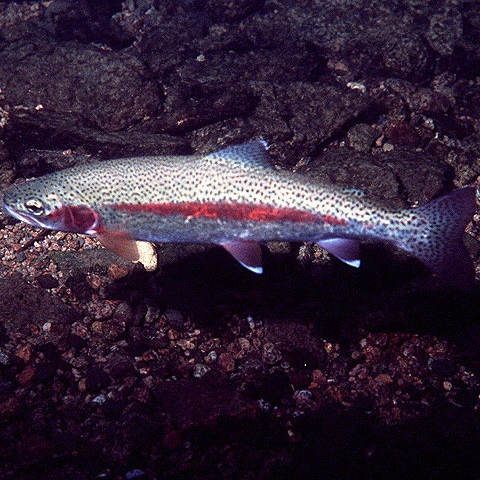
Genome version:
USDA_OmykA_1.1
Transcriptome source:
> FishGET assembly
> NCBI(RefSeq assembly)
Bioproject source: NCBI(SRA)
Classification:

Genome version: GENO_Pfluv_1.0
Transcriptome source:
> FishGET assembly
> NCBI(RefSeq assembly)
Bioproject source: NCBI(SRA)
Classification:
(Danio rerio)
(Ctenopharyngodon idella)
(Oncorhynchus mykiss)
(Perca fluviatilis)
(Pangasianodon hypophthalmus)
(Amia calva)
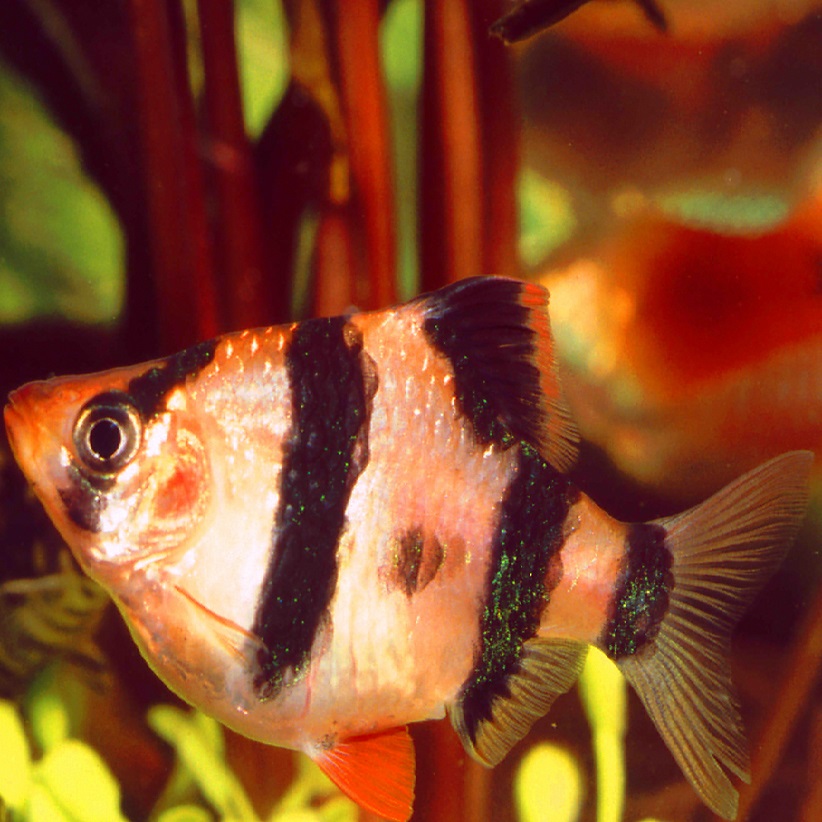
(Puntius tetrazona)
(Astyanax mexicanus)


.")


