Species-corresponding genomes and annotations
| Species name | Genome version | Download url |
|---|---|---|
| Danio rerio | GRCz11 | Download |
| Protopterus annectens | GCF_019279795.1 | Download |
| Monopterus albus | GCF_001952655.1 | Download |
| Gadus morhua | GCF_902167405.1 | Download |
| Clupea harengus | GCF_900700415.2 | Download |
| Salmo salar | GCF_000233375.1_ICSASG_V2 | Download |
| Lates calcarifer | ASM164080v1 | Download |
| Collichthys lucidus | GCA_004119915.2 | Download |
| Amia calva | GCA_016984155.1 | Download |
| Ictalurus punctatus | GCF_001660625.1_IpCoco_1.2 | Download |
| Cyprinus carpio | GCF_018340385.1_ASM1834038v1 | Download |
| Perca fluviatilis | GCF_010015445.1 | Download |
| Pimephales promelas | GCF_016745375.1 | Download |
| Ctenopharyngodon idella | GC_v1 | Download |
| Xiphophorus hellerii | GCF_003331165.1 | Download |
| Coregonus clupeaformis | GCF_020615455.1 | Download |
| Larimichthys crocea | GGCF_000972845.2 | Download |
| Siniperca chuatsi | GCF_020085105.1 | Download |
| Oryzias latipes | GCF_002234675.1 | Download |
| Astyanax mexicanus | GCF_023375975.1 | Download |
| Triplophysa tibetana | GCA_008369825.1 | Download |
| Oreochromis niloticus | GCA_001858045.2 | Download |
| Oncorhynchus mykiss | GCF_013265735.2_USDA_OmykA_1.1 | Download |
| Labeo rohita | GCA_004120215.1_ASM412021v1 | Download |
| Hypophthalmichthys molitrix | CNP0000974 | Download |
| Channa argus | GCA_004786185.1 | Download |
| Lepisosteus oculatus | GCF_000242695.1 | Download |
| Tetraodon nigroviridis | GCA_000180735.1 | Download |
| Pangasianodon hypophthalmus | GCF_009078355.1_GENO_Phyp_1.0 | Download |
| Puntigrus tetrazona | GCF_018831695.1 | Download |
| Takifugu rubripes | GCF_901000725.2 | Download |
| Gasterosteus aculeatus | GCF_016920845.1 | Download |
| Nothobranchius fuzeri | GCF_027789165.1 | Download |
| Megalobrama amblycephala | GCF_018812025.1_ASM1881202v1 | Download |
| Tachysurus fulvidraco | GCF_003724035.1_ASM372403v1 | Download |
DNA information

DNA information: a: Basic gene information, including gene name, location, species, sequence, etc., where the FishCODE id is used for precise retrieval of the API. b: Visualization of the structure of the gene (supported by JBrowse2), c: All SNP information corresponding to the gene, please click on any row to obtain the detailed information of the corresponding SNP, d: Visualization of the average methylation rate of the gene, the user can click FECO plug-in (see the description of FECO in the datasets section for details), select the data set of interest, and the visualization of the methylation rate at different positions of the corresponding genes can be refreshed below (note that not all genes will have this information, considering Different coverage for different data sets)
SNP information
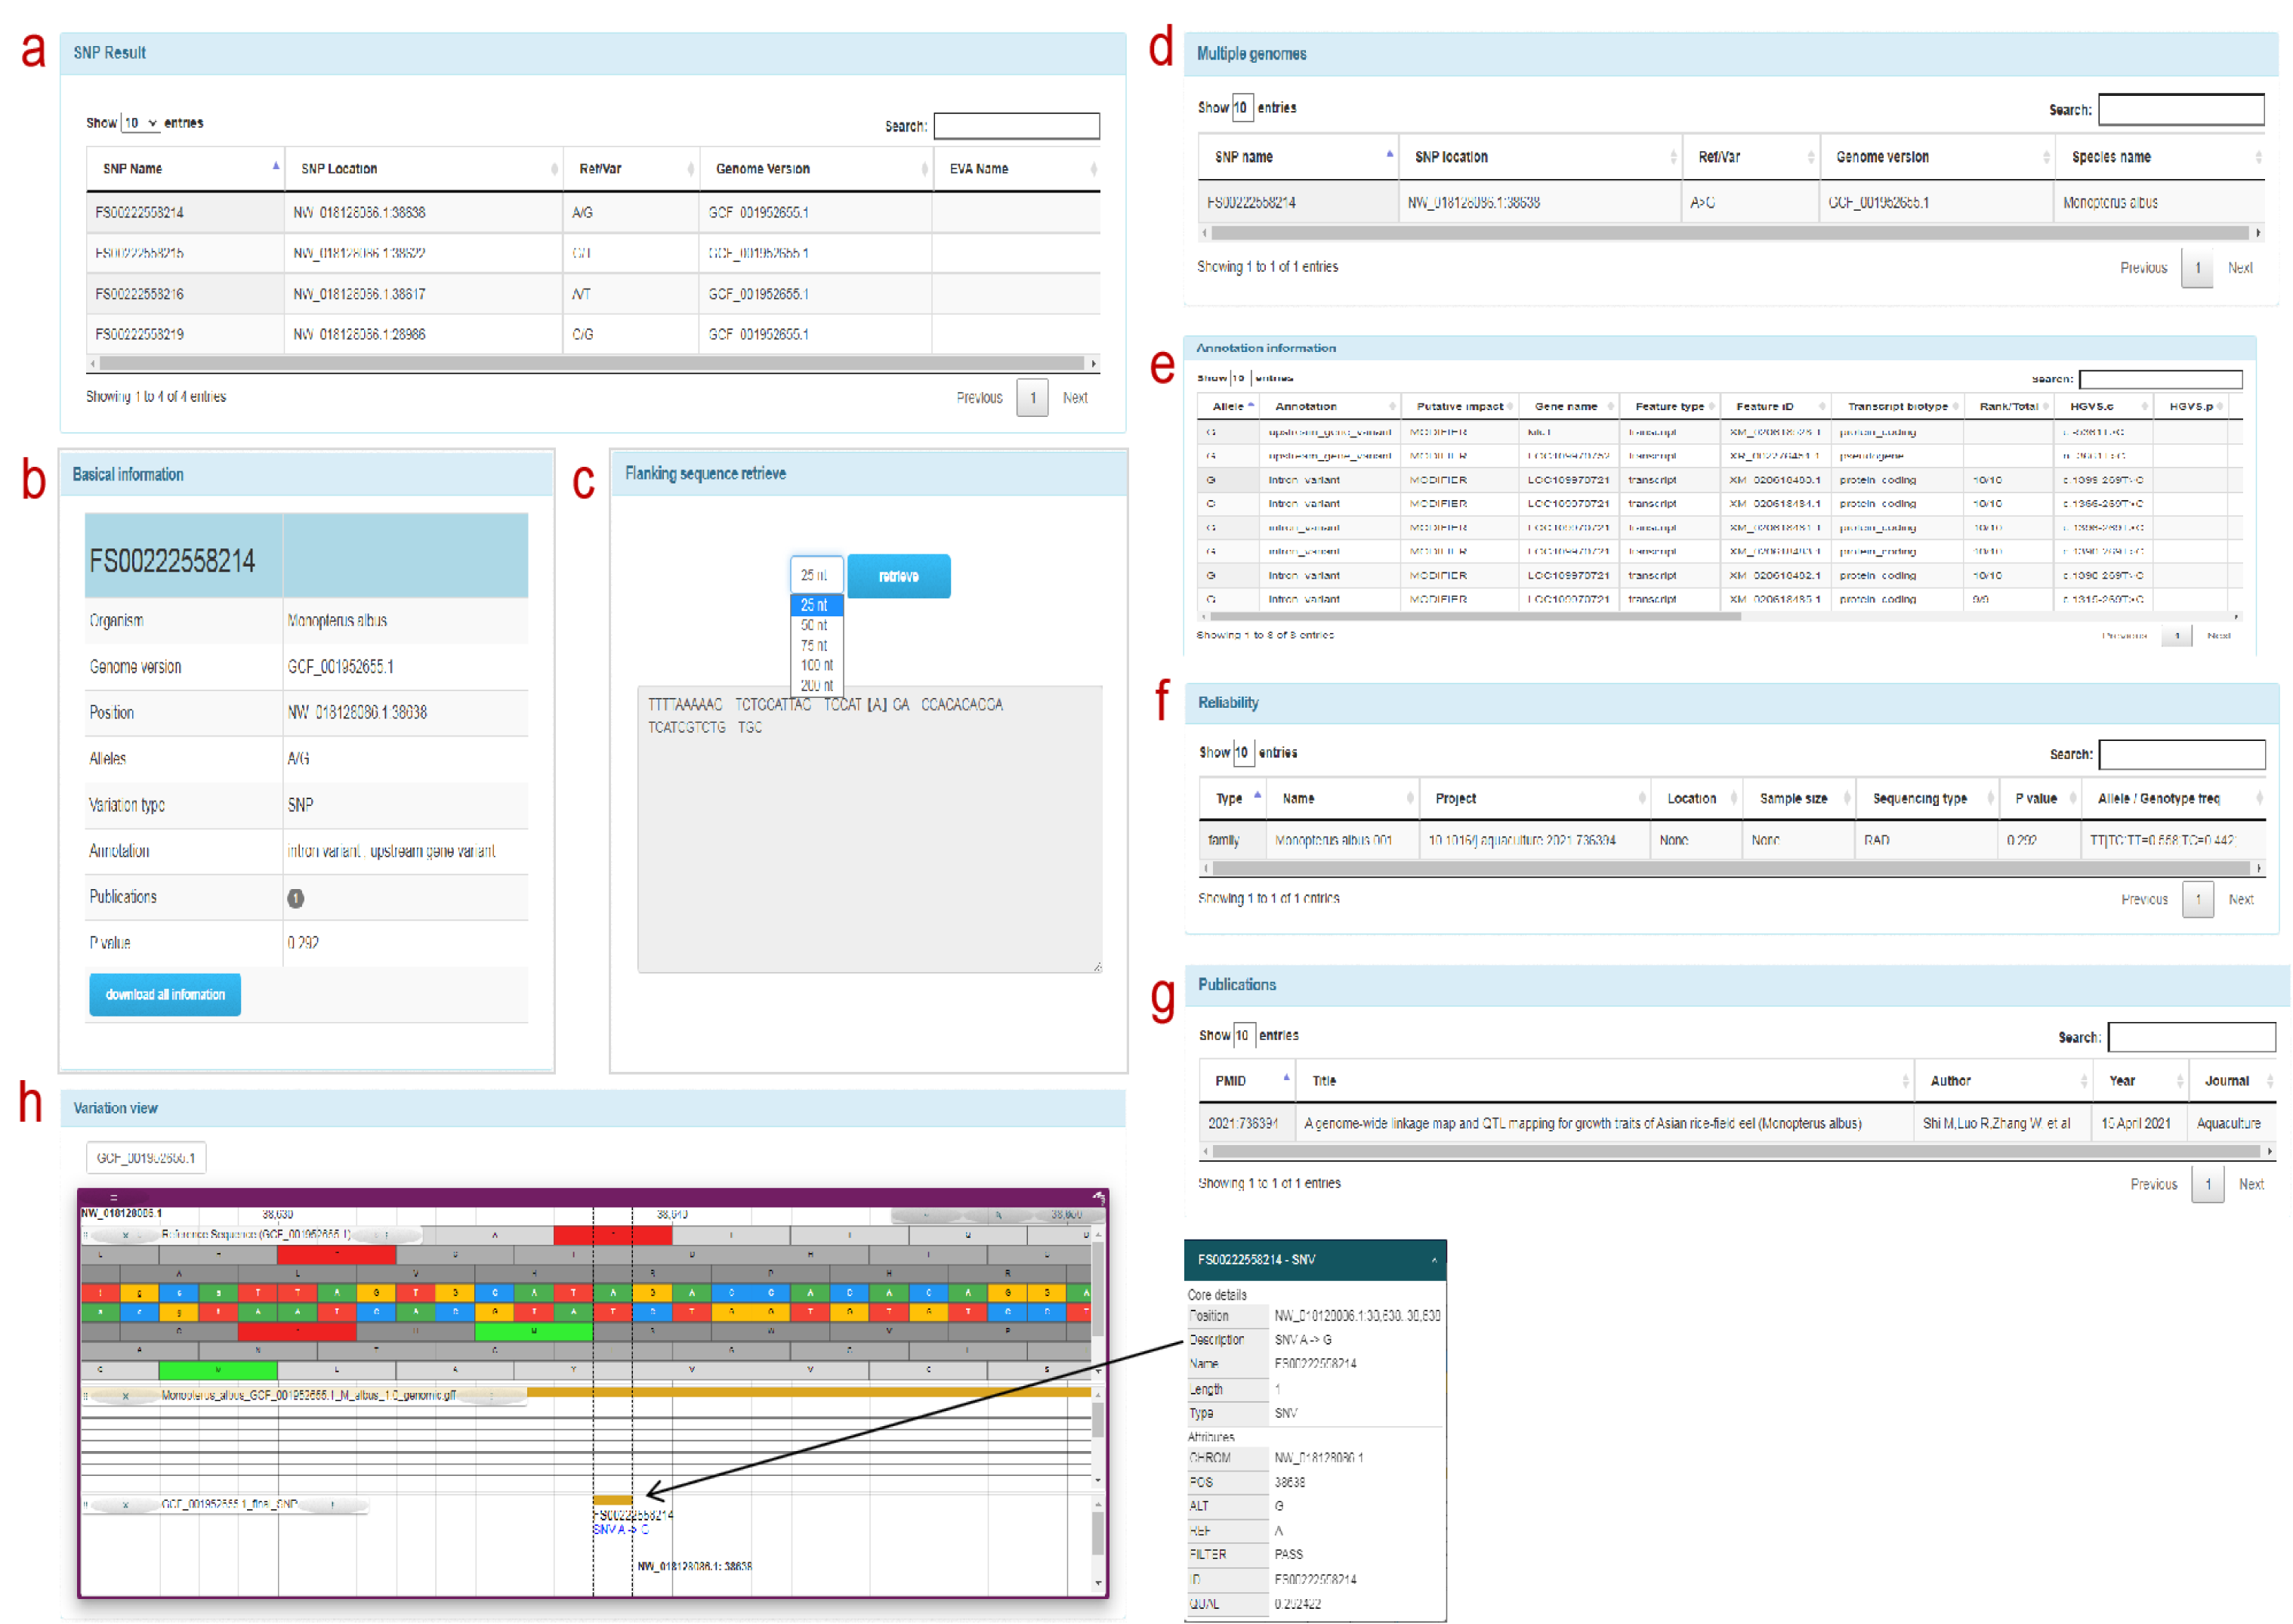
SNP information: a: SNP information associated with the FishCODE gene page, users can click on the SNP form row to jump to the detailed information page of the SNP, b: basic information of the SNP site c: SNP flanking sequence (optional distance) d: multiple genome positions Point comparison information e: SNP genome annotation information. f: Population type, size, sampling location and other information. g: Article information h: SNP visualization information display. Click the target variation to display the position information of the SNP and its adjacent sites on the genome, as well as the detailed information of the SNP site.
RNA information

RNA information: a, b, c: Gene expression level (TPM) visualization. Users can click on the FECO plug-in (see the description of FECO in the datasets section for details) and select the new and interesting data set. The visualization of the corresponding gene expression level can be refreshed below. , d: Users can perform group statistics, select the corresponding group, statistical parameters, etc. and click the "Submit" button. e: Visualize the corresponding group statistics, error marks, and significance marks. f: Considering that some group names are too long, which will affect the visualization effect, we have mapped the overly long names to "group x". g: The corresponding download file of the visual image, in which the ggplot2 object file can be input into Visual Omics to continue style adjustment.
Protein information

protein information: a: The best matching gene for the longest protein of this gene in fish (swiss-prot), including the best matching gene in all vertebrates, and also separately compared humans, rats, mice, zebrafish, and fruit flies And provides corresponding comparison information b: protein domain information c: protein subcellular localization information, the user clicks on the corresponding protein corresponding to other species (best match, as described in a), d: association information provided by string
Annotation
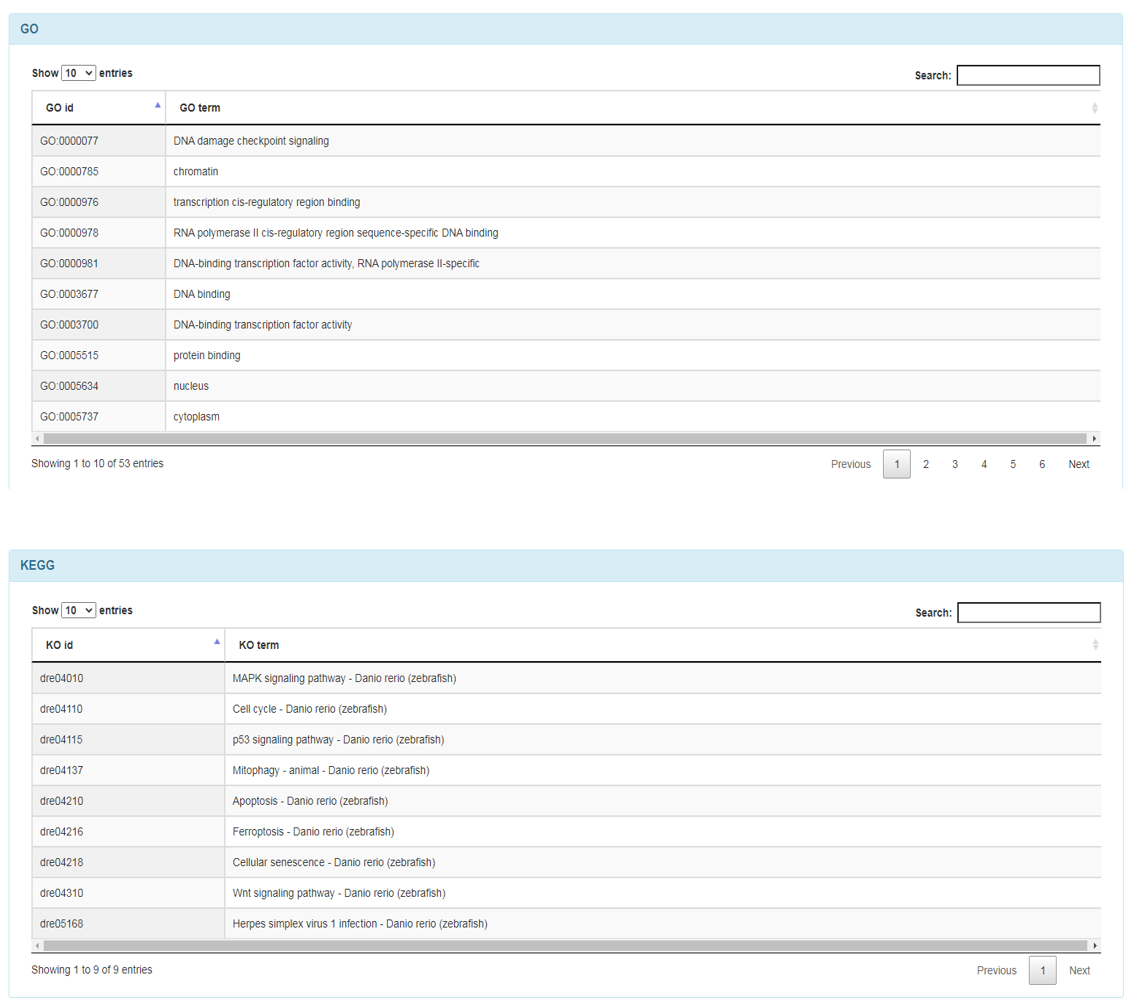
Annotation: it is important to note that the source of annotation information for non-model species is the same as the annotation information for the best-matching species protein.
Choose data
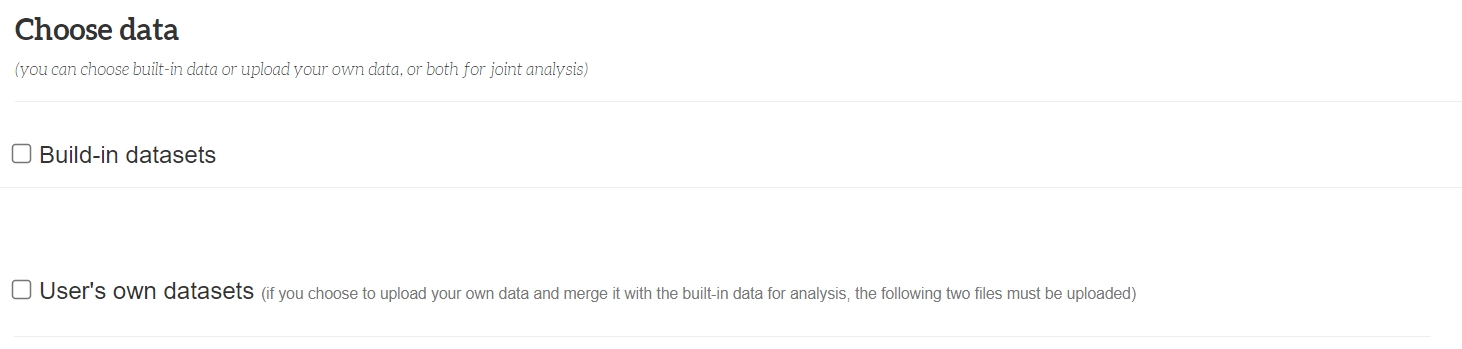
Choose data: FishCODE analysis samples can come from built-in datasets or/and from user-uploaded datasets, so in the "Choose data" section, you can select "Build-in datasets" (selected by default) or/and "User's own datasets", select the corresponding Checkbox means selecting the corresponding part, unchecking the box means not using the part.
Build-in datasets selectors

Selectors: user selects the species selector on the left and then the experimental factor selector on the right, and each time the user clicks on the selector, the dataset list below refreshes. The content of the experimental factor selector on the right will actively change and refresh as the species selected by the user changes. When canceling the checkbox in the upper left corner, an operation prompt box will pop up. The user needs to confirm his cancellation operation. Click "Confirm" in the lower right corner to confirm this operation, or click the "Cancel" button to cancel this operation.
User's own datasets
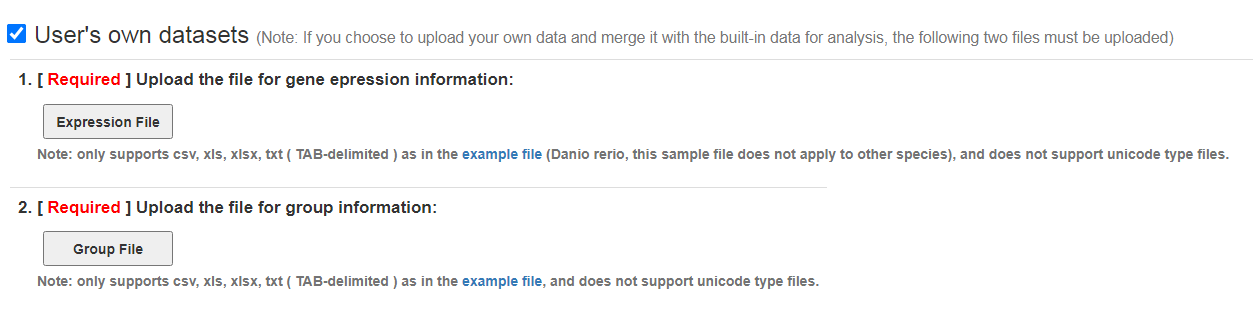
User's own datasets: this module is closed by default. Click the checkbox in the upper left corner to expand the module and upload data. It should be noted that the "Group File" file must be uploaded. When you cancel the checkbox in the upper left corner, an operation prompt box will pop up, which is similar to the description in the "Build-in datasets selectors" section.
Design experiment
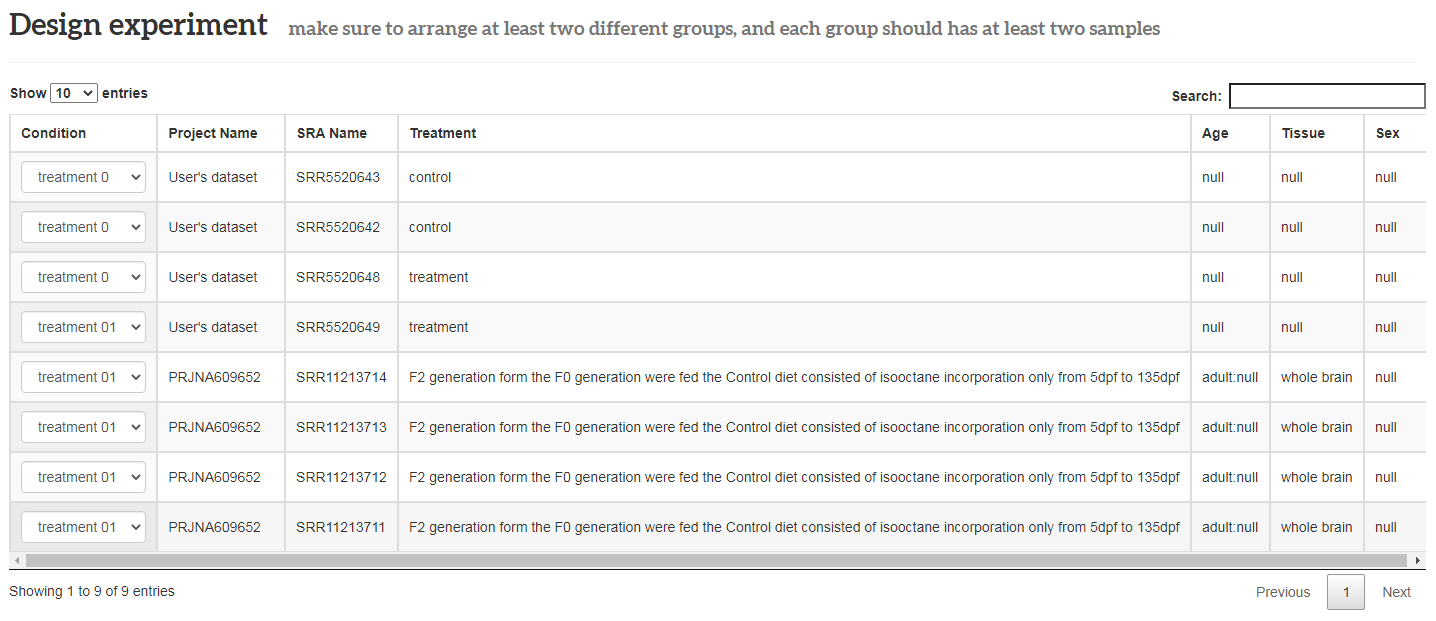
Design experiment: user arranges the combined data samples into groups. Note that the transcript group must meet at least 2 groups, and each group has at least 2 samples. It is worth noting that the files uploaded by users should not be larger than 200MB and the sample size of a task cannot exceed 30 samples.
Remove batch effects
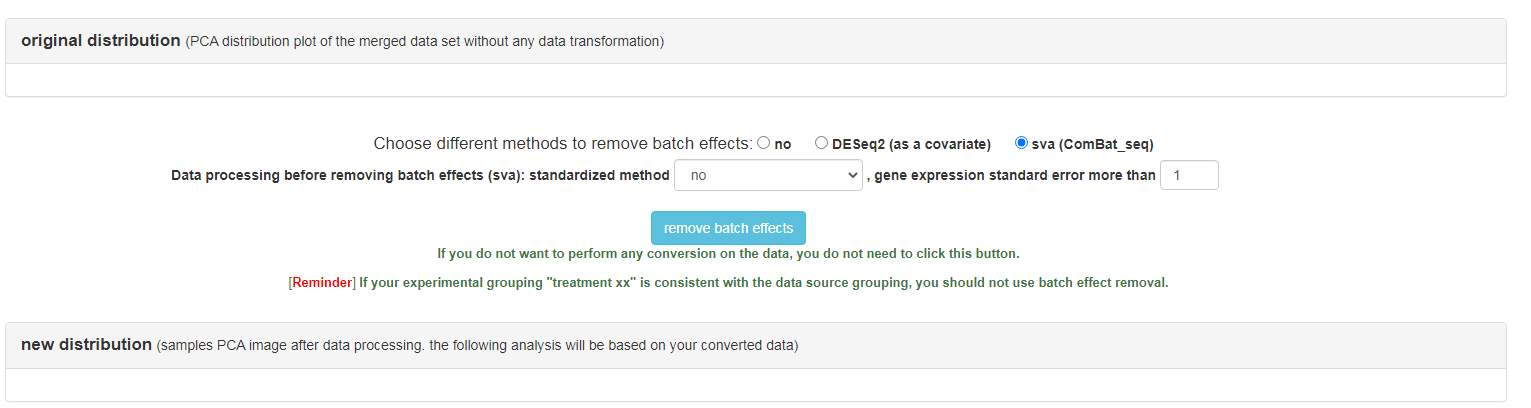
Remove batch effects: original distribution: It shows the pca results of the data set finally formed by the user after scale normalization, and the default is to draw the confidence interval according to the project name. new distribution: There are many ways to process the batch effect of data. 1. Use the built-in function of DESeq to add the batch effect category as a covariate to the analysis. 2. ComBat uses the ComBat_seq function of the sva R package for data correction. Of course, if the original distribution has no obvious batch effect, the user can also select no to use the original distribution for the following analysis.
Analyze data

Analyze data : parameters cover quality control, differential analysis parameter settings, visualization parameters for display results (heat maps), etc.
Result visualization
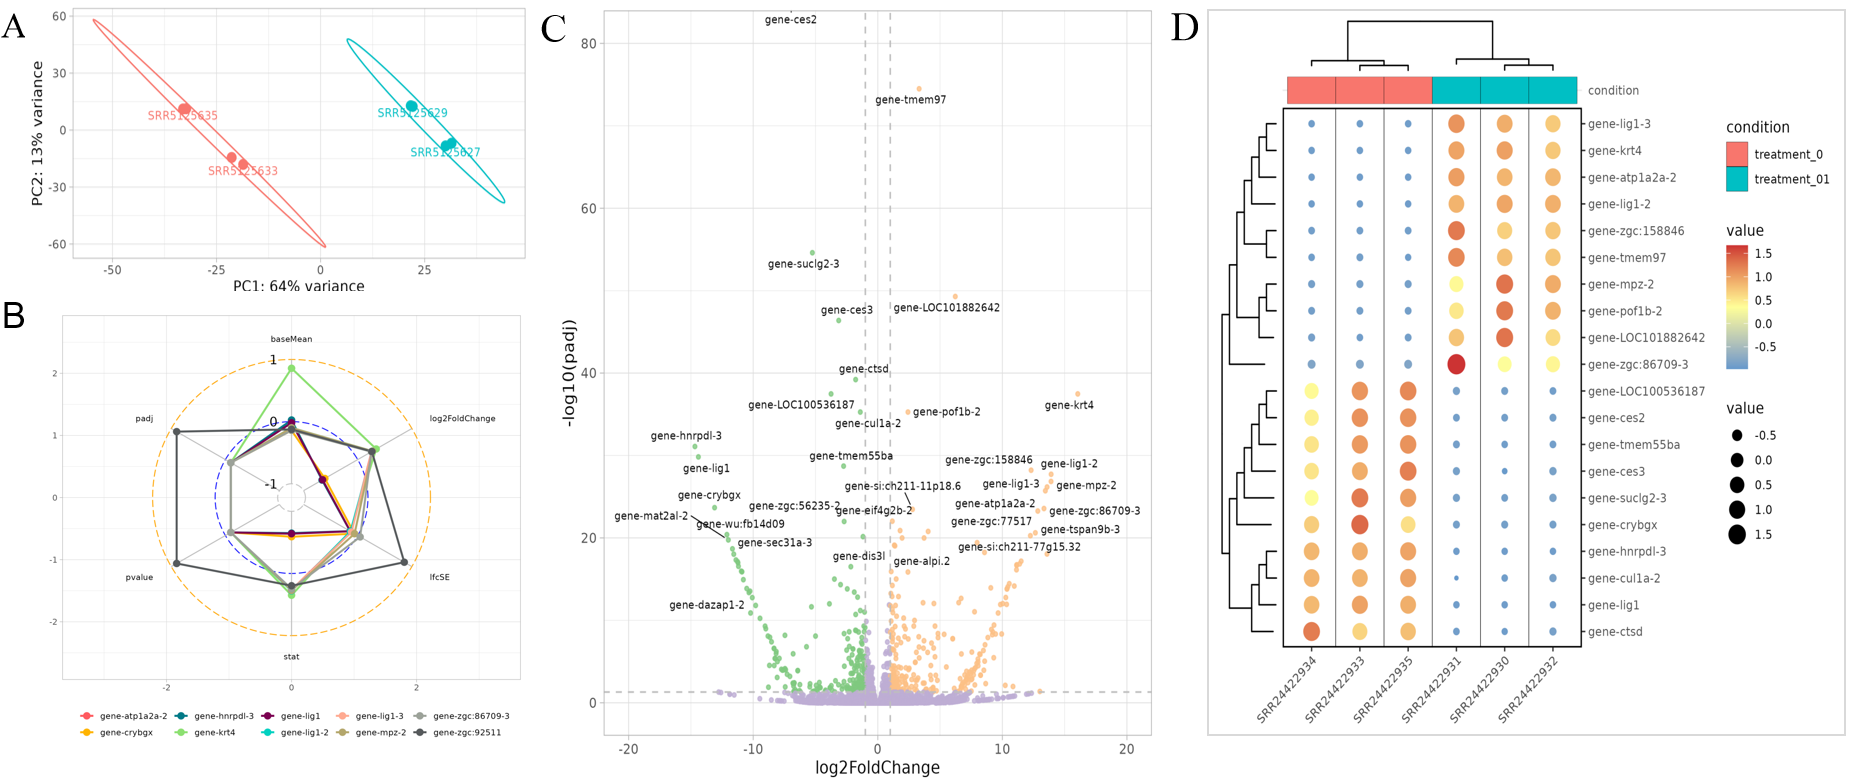
Result visualization : (A) Visualization of sample PCA analysis results. (B) The information (including gene abundance, fold change, P value, etc.) of the genes (the top 10 genes with the largest absolute value of default log2FoldChange). (C) Volcano plot of differentially expressed genes. (D) Heatmap of the most significant differentially expressed gene (the top 50 genes with the smallest p value by default).
Fine tuning parameters/behavior
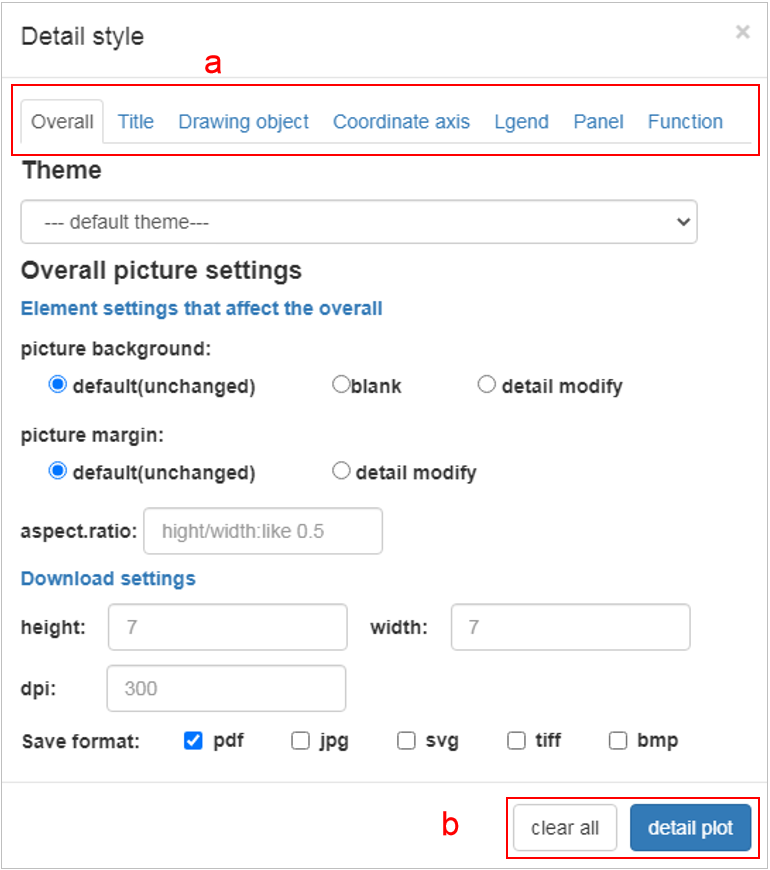
Fine tuning parameters: all parameters are divided into seven parts as shown in a. Overall: Represents the overall parameters of the image such as image format, resolution, etc. Title: Represents the title settings of the most commonly used pictures, including the main title, subtitle, lower right/upper left title, x/y axis title and legend title. Drawing object: Represents the properties of the picture drawing object, that is, the data is mapped to color, size, padding, etc. Coordinate axis: style: All settings of the x/y axis except the title include the styles of the axis, labels, etc., as well as the property settings for the x/y axis of the data. content: For continuous and discrete designs, including data transformation, location, label reset (breaks, labels). Legend: The style setting parameter part of the legend. Panel: This part mainly sets the panel style, you can cancel the auxiliary line, change the panel color, etc. in this part. Function: This part integrates some functions, including adding image element name, adding text on the image, enlarging the image, reversing the coordinates and other functions. After setting the parameters, click the detail plot in part b to modify the picture. By default, the results of each modification will not be cleared. If you want to clear all previous options, please click the clear all button in part b.
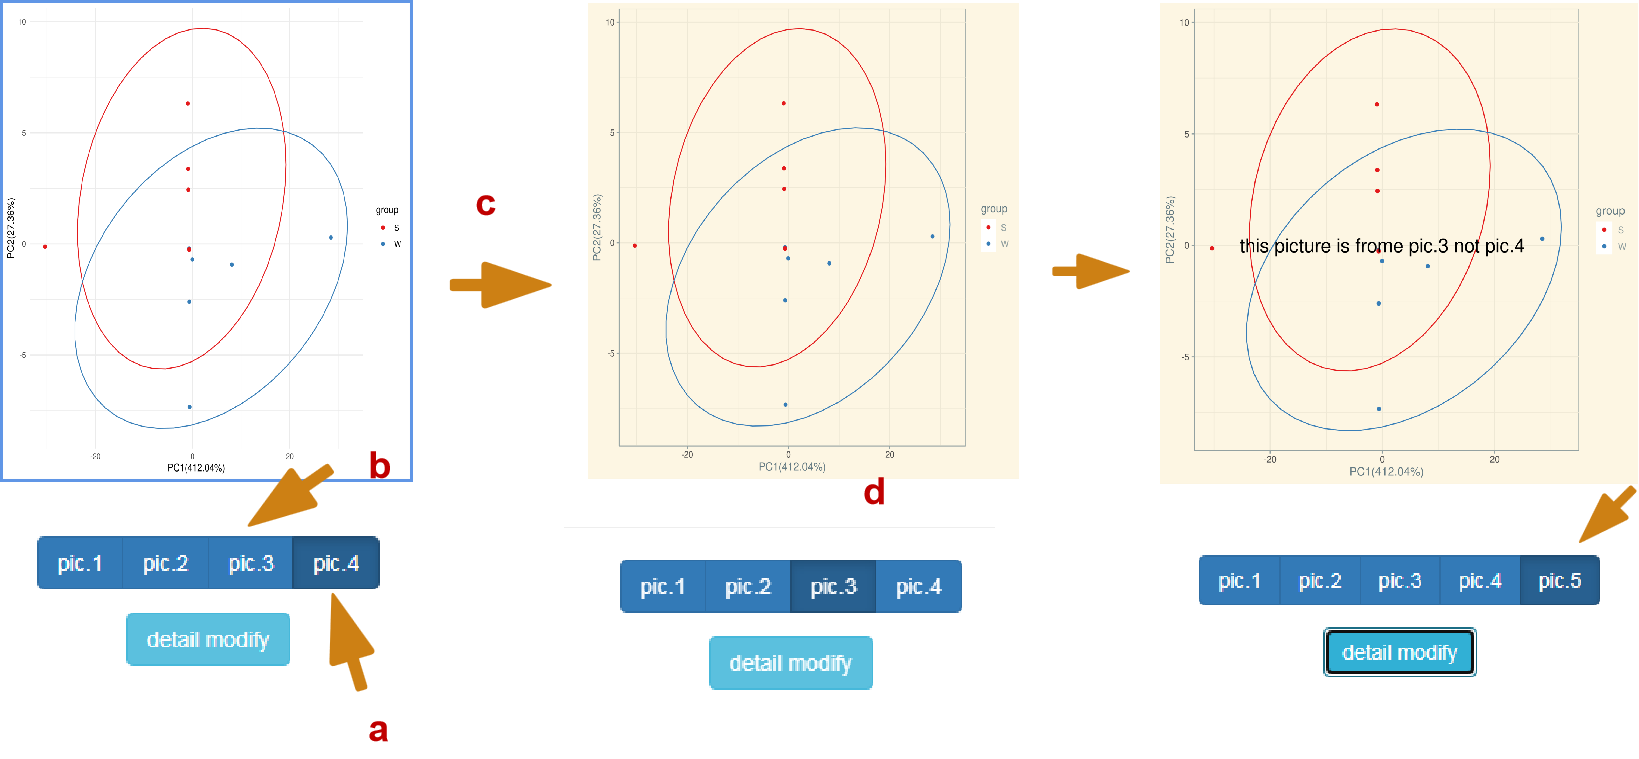
Fine tuning behavior: each time you click detail modify, you will submit once, as shown in A. at present, the user has submitted to PIC4. At this time, click pic. 3, as shown in B, and you will jump to pic. 3 to submit the picture, as shown in C. Any modification at this time is based on PIC. 3. As shown in pic. 5, the figure is actually modified from pic. 3 rather than PIC4. If you find that you still haven't added after switching, it should be that the content of your selection panel is not clear and clean.
FishCODE sources

FishCODE sources: the analysis results provide an online differential analysis gene list, and the user clicks on the gene to jump to the detailed information page of the gene in the database.
Download
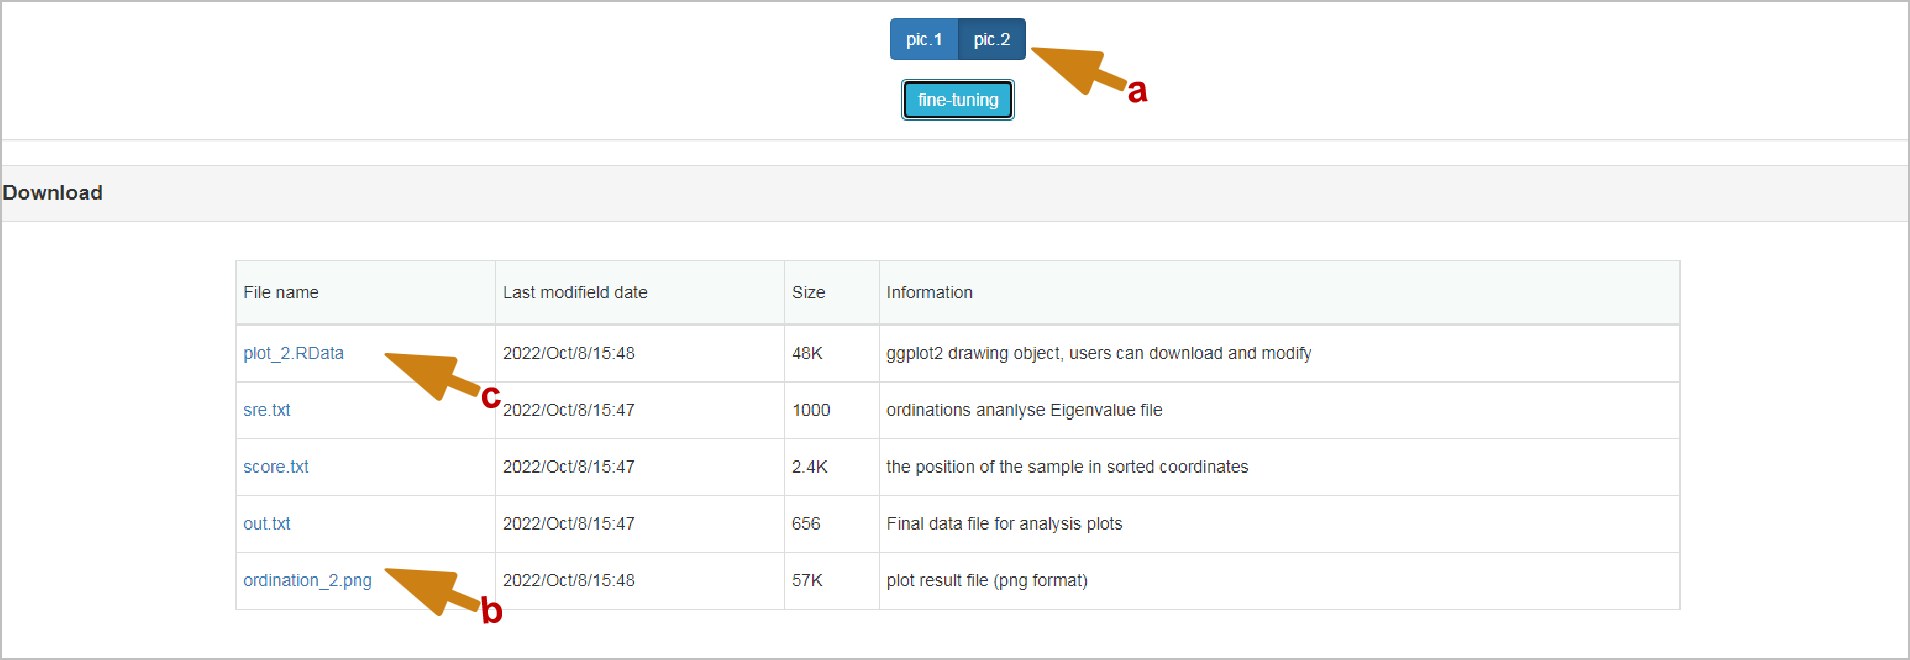
Download: pictures in any format are based on orders_ It's named in the form of number. It's worth mentioning that the content of downloaded files will be switched with the switching when the switching is different. There's no need to worry about the mismatch between downloading and switching. Another important thing is, for example, PIC. 1 in the picture, but it is in the download_ 3. There is a conversion relationship between the two, so don't worry. Except for the pictures, all the intermediate results of the analysis are given in TXT format. The file at the end of. Data is the R native object, which may be helpful to you
More omics downstream analysis
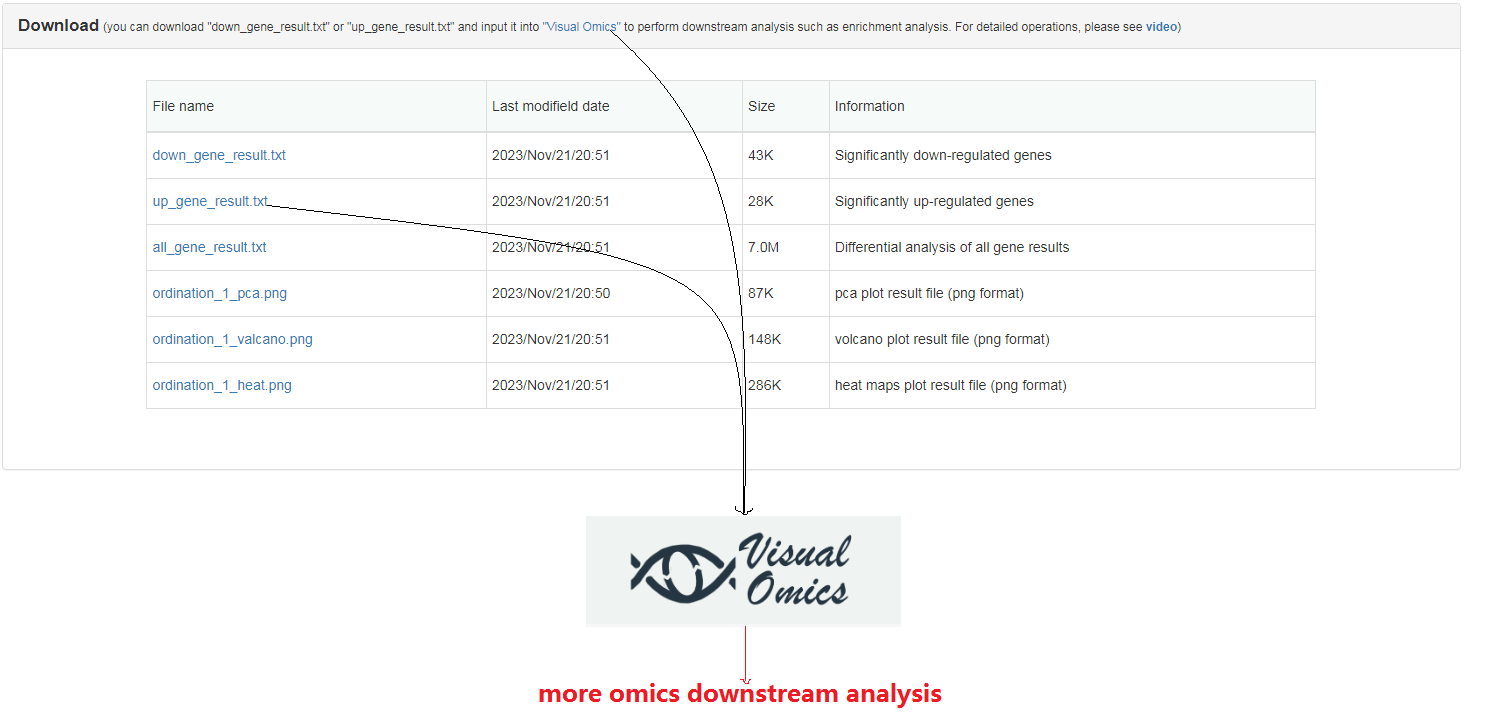
More omics downstream analysis: you can download the differential up/down results file from this page and upload them to "Visual Omics" (part of FishCODE, an independent online analysis tool that supports multiple omics analyzes and highly free result visualization adjustments) without any format changes for corresponding analysis module. For detailed operation, please watch this video.
Err report
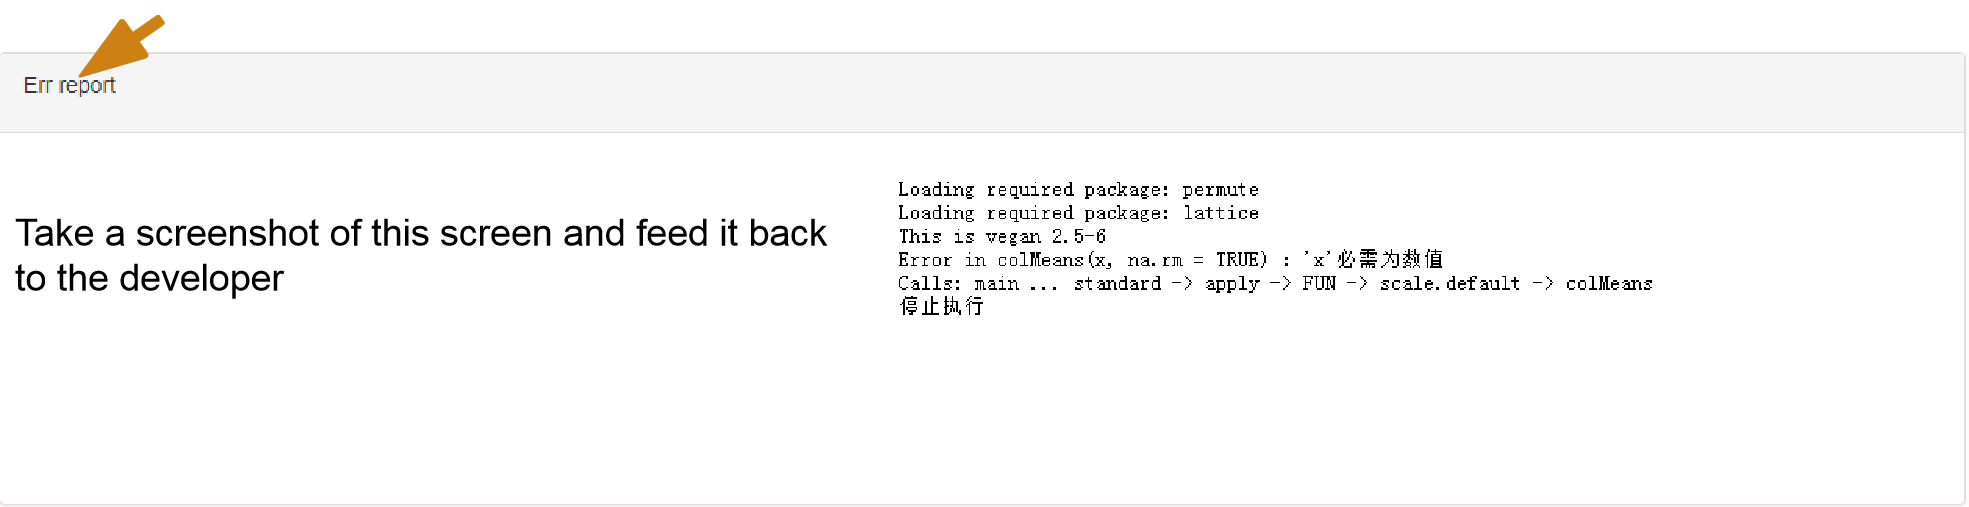
Err report:If you find a bug, please inform the author of the error in time and declare again that this version is a test version and should have many bugs. If you find anything abnormal in the process of use, please be sure to feed back the error information to me. I will be very grateful. When you feed back the error, you need to click the place shown in the figure to feed back the err report screenshot and the error to me.
SNP annotation
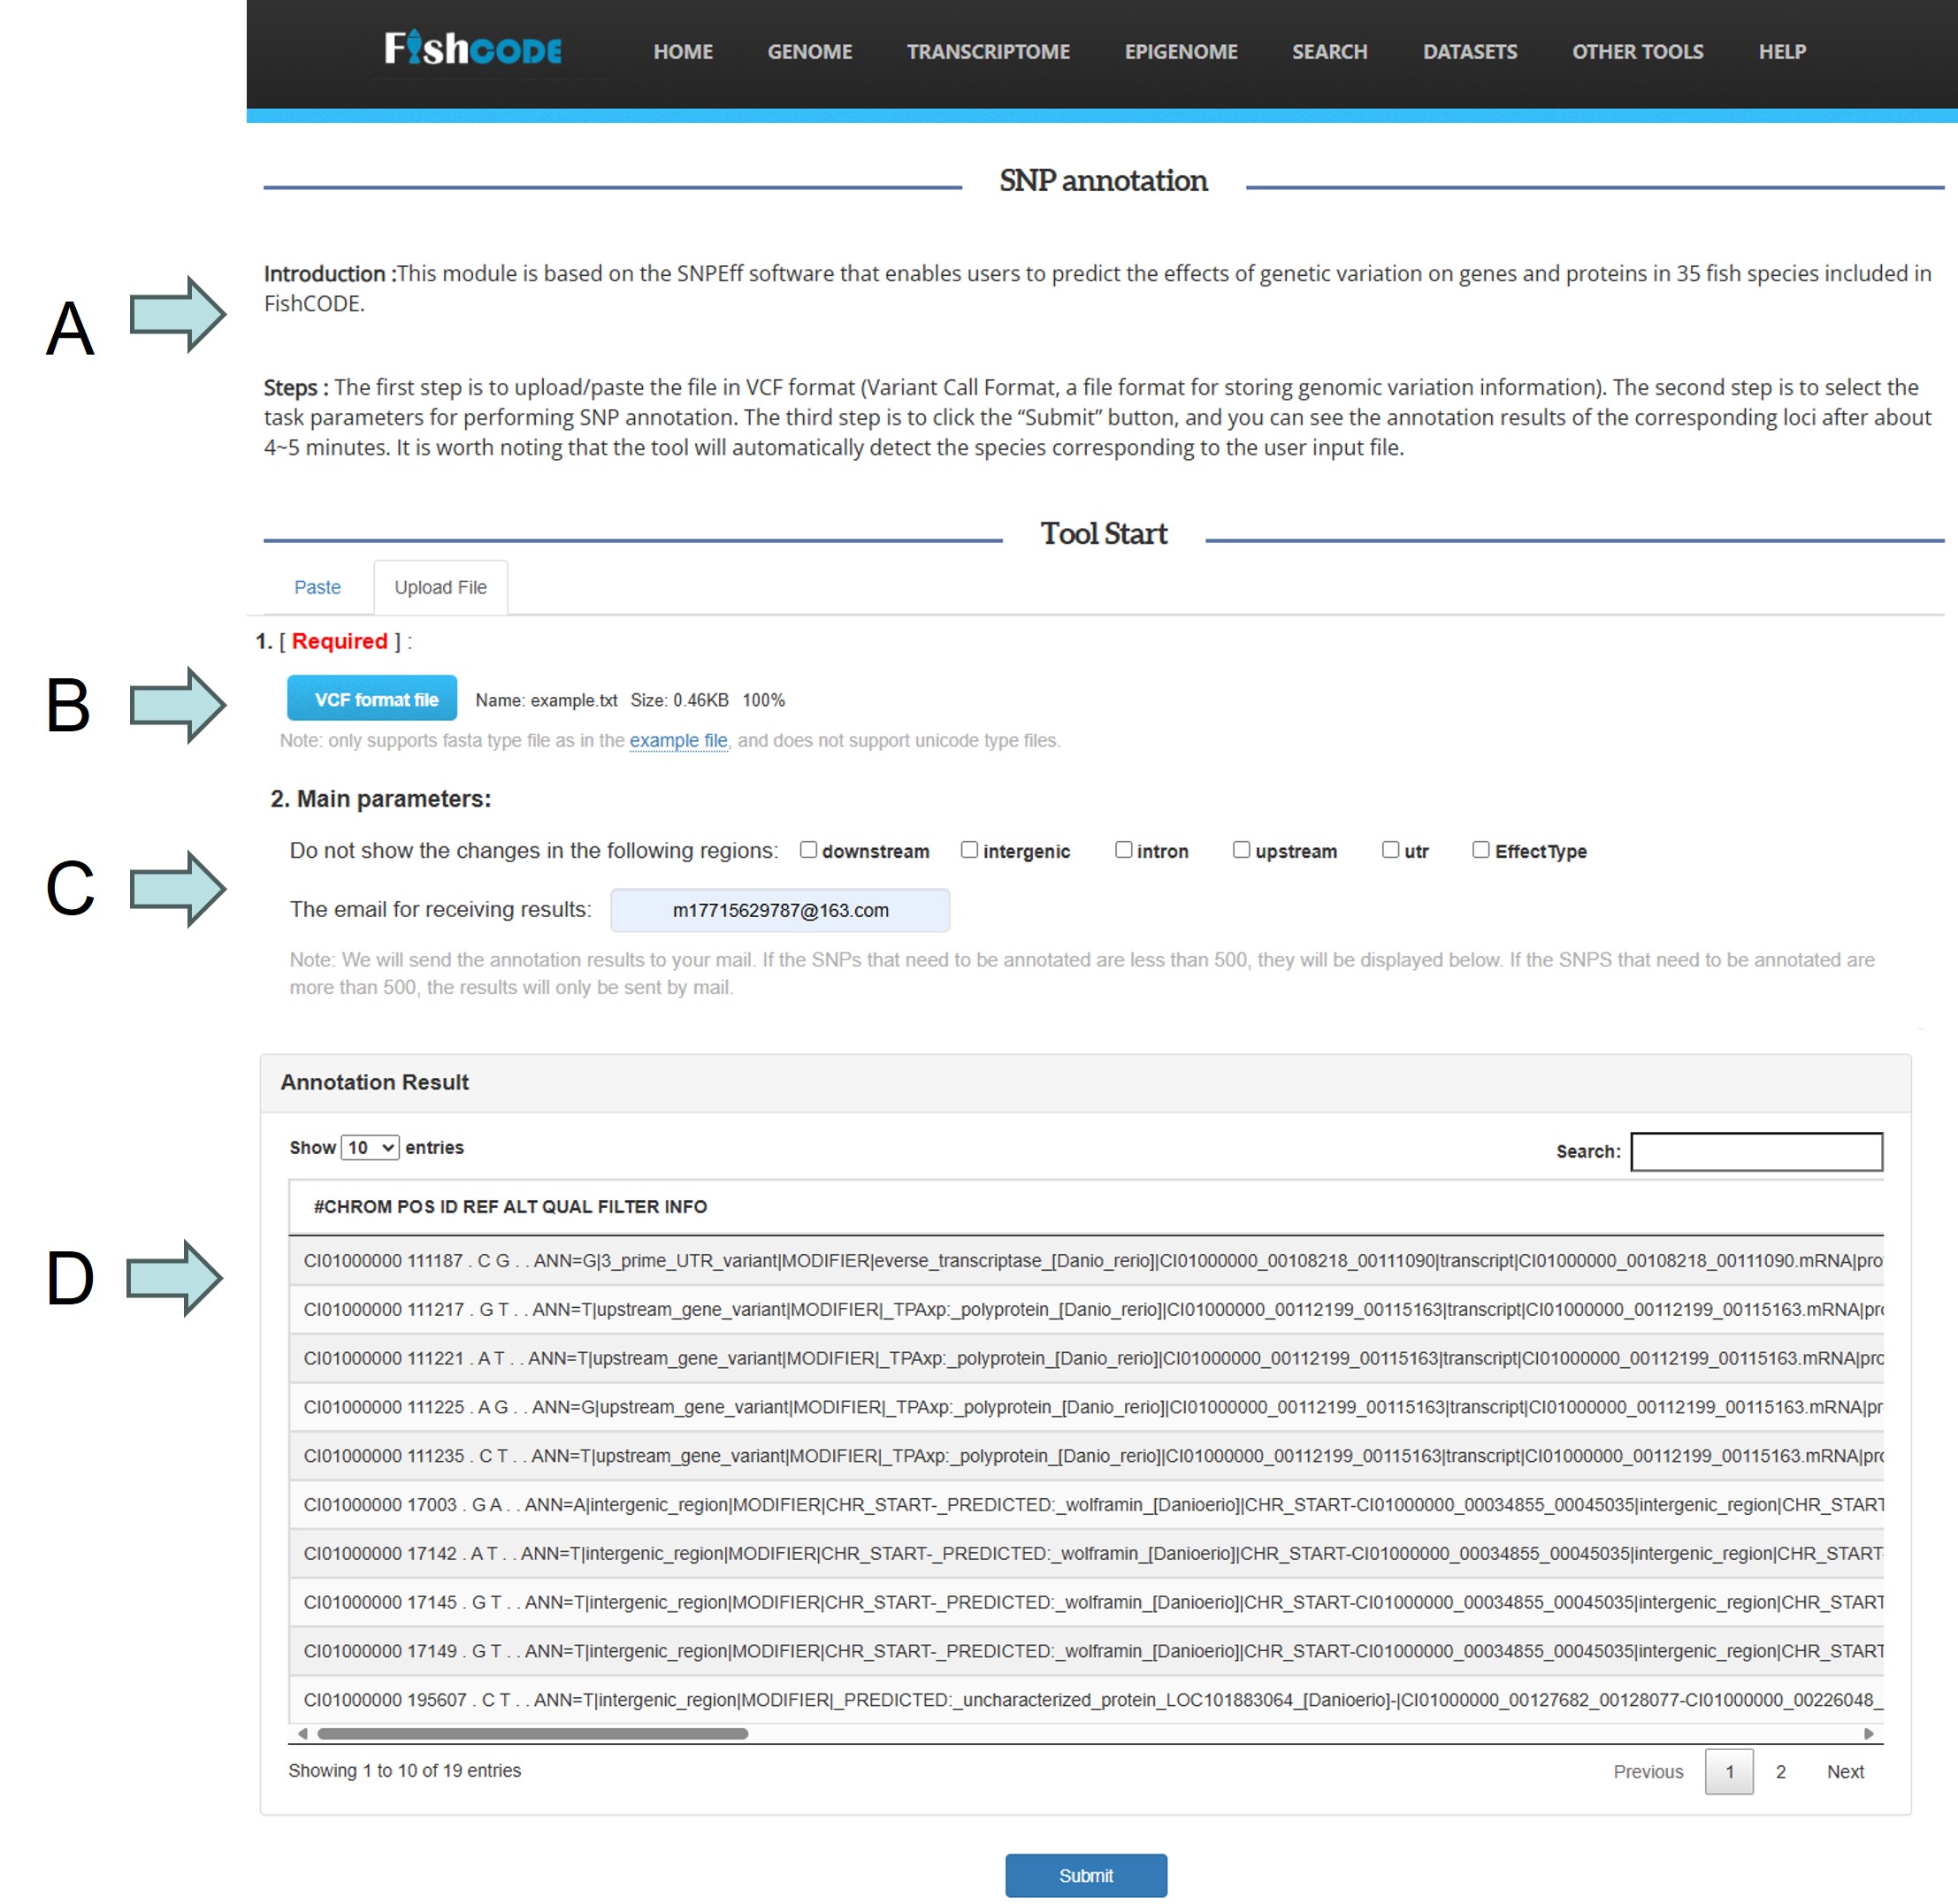
SNP annotation: A. Introduction to tools, practical basic steps and underlying dependent software. B. User upload file module, includes copy upload and file upload. There is a corresponding demonstration input file at the description below this module C. Input parameters of the tool include email message and comment parameters, and when the user inputs more than 500 SNPs the default choice is to send an email. D. SNP function annotation results online form.
Evolutionary analysis tool
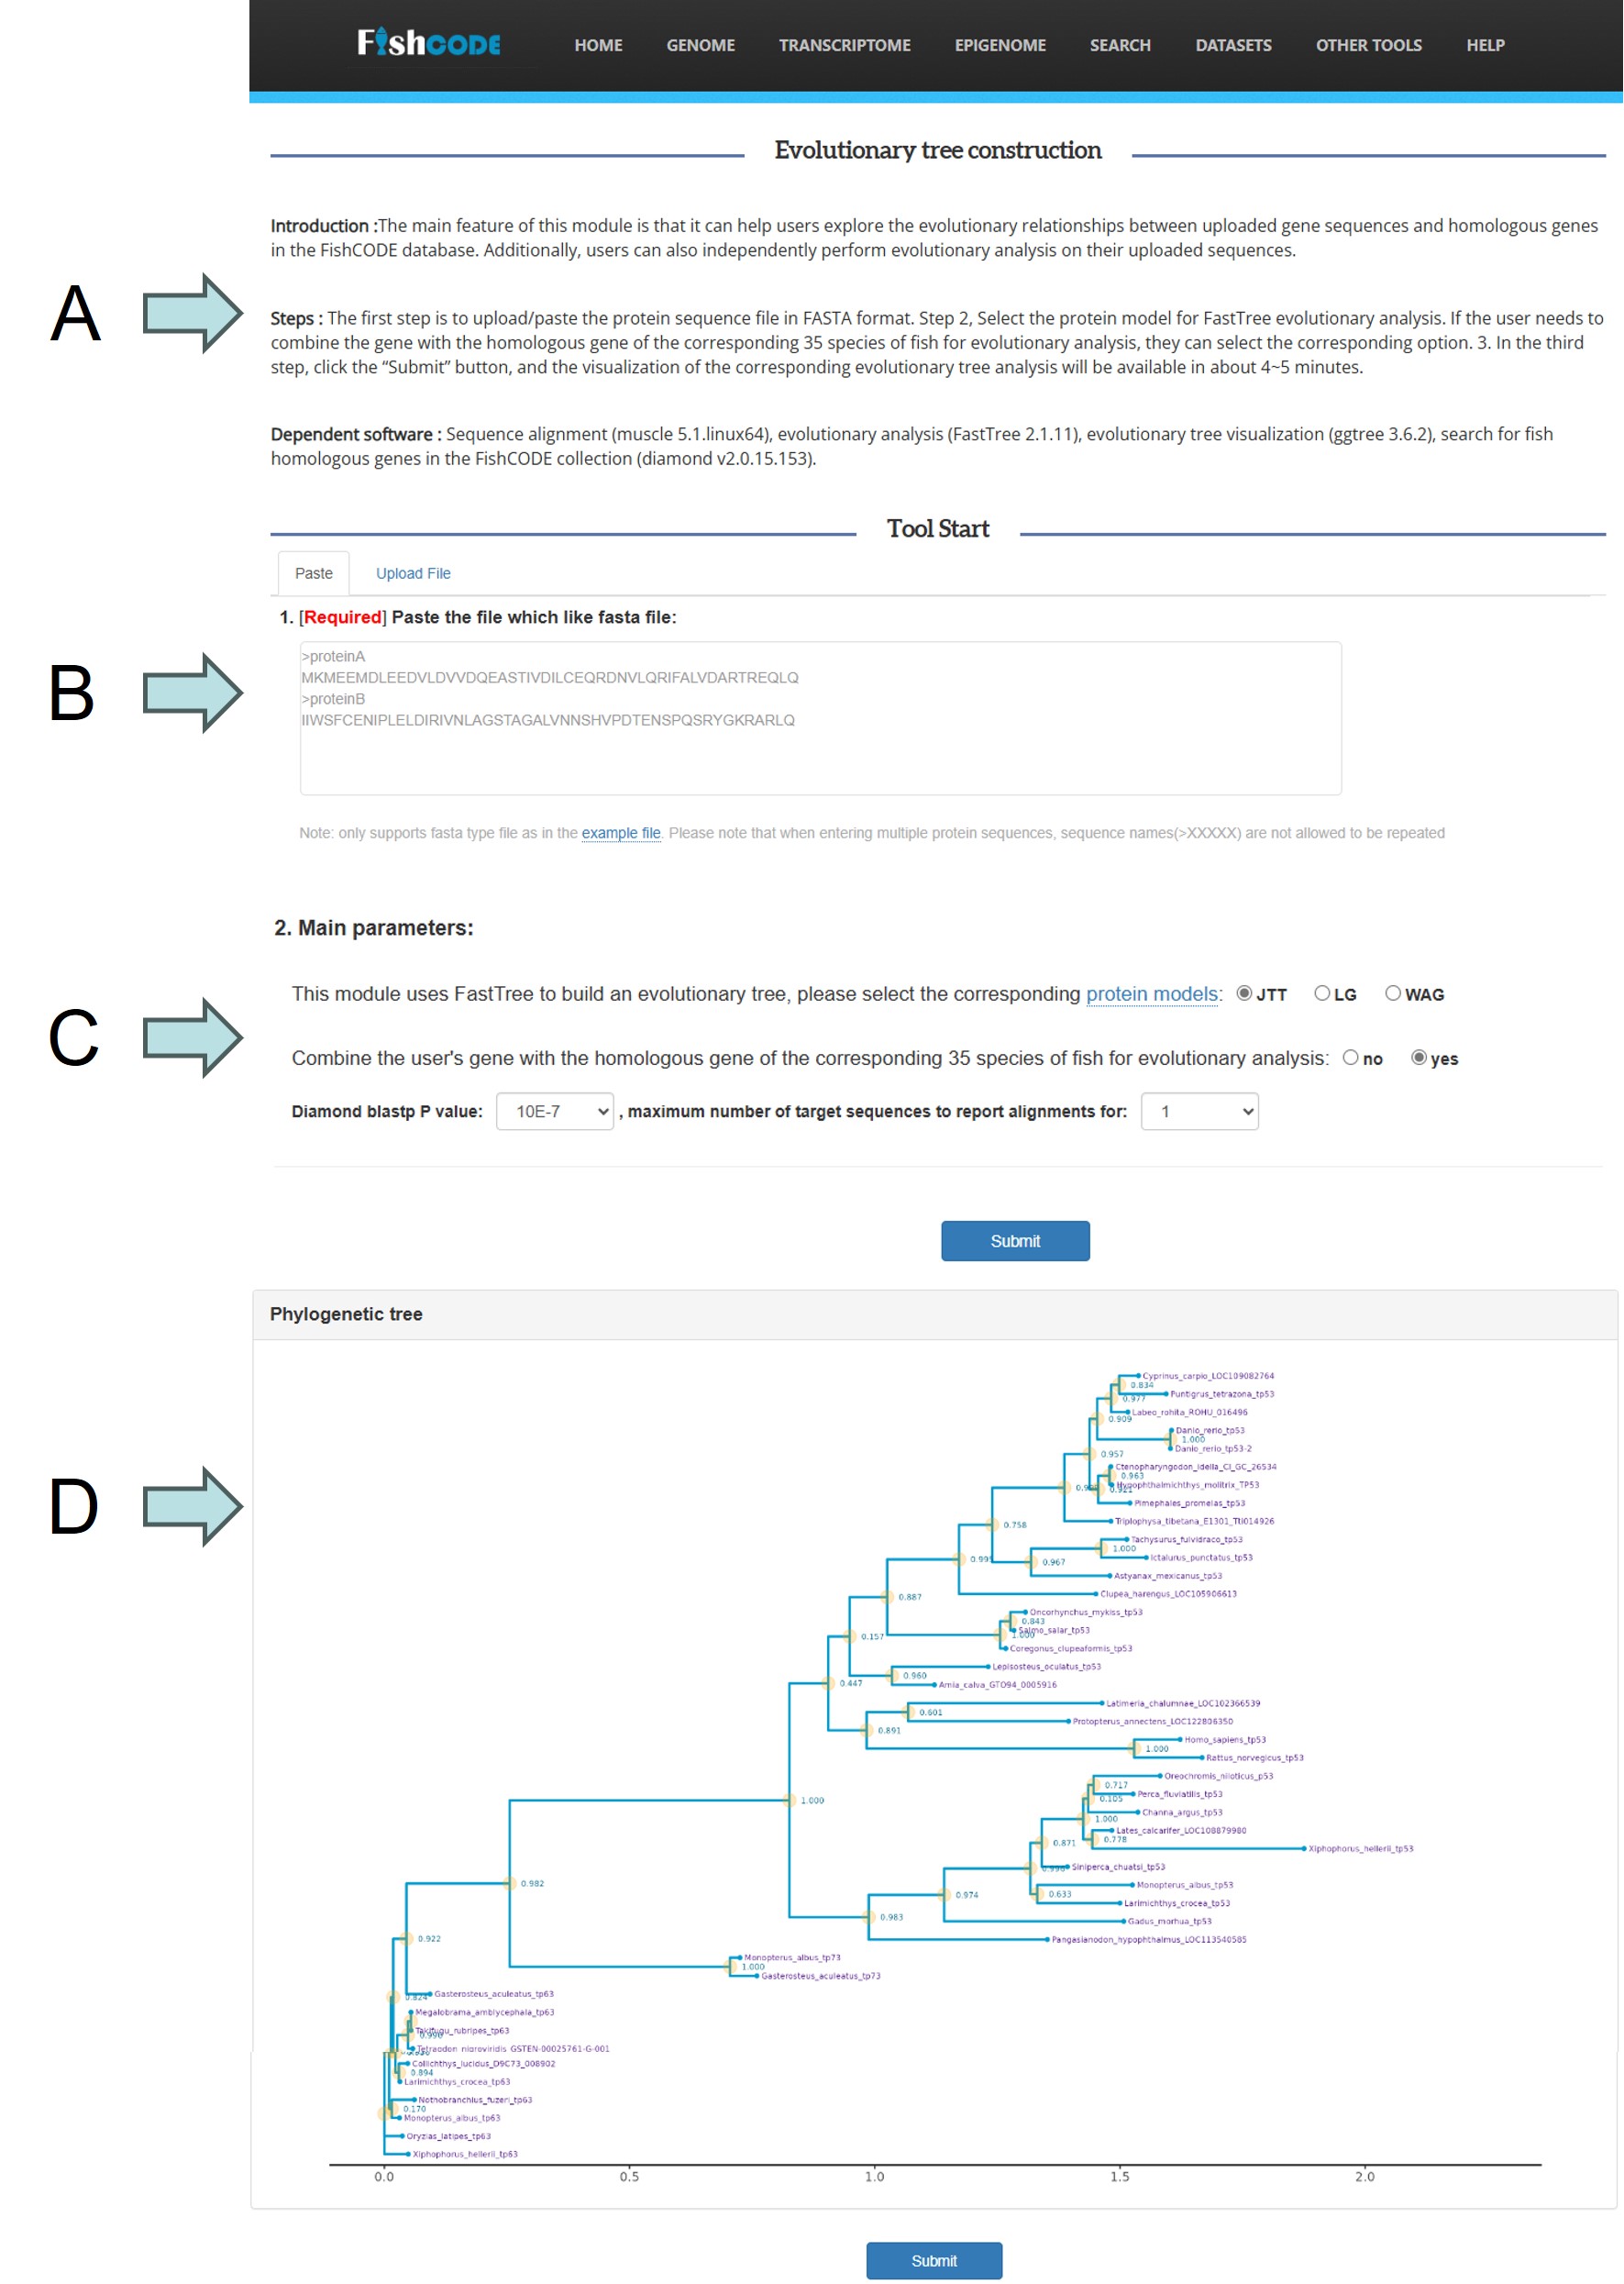
Evolutionary analysis tool: A. Introduction to tools, practical basic steps and underlying dependent software. B. User upload file module, includes copy upload and file upload. There is a corresponding demonstration input file at the description below this module C. Input parameters of the tool including protein models and matching parameters of more than 9000,000 proteins in the FishCODE collection. D. Phylogenetic tree visualization results between user input genes and FishCODE highly similar genes.
Comparative genomics browser
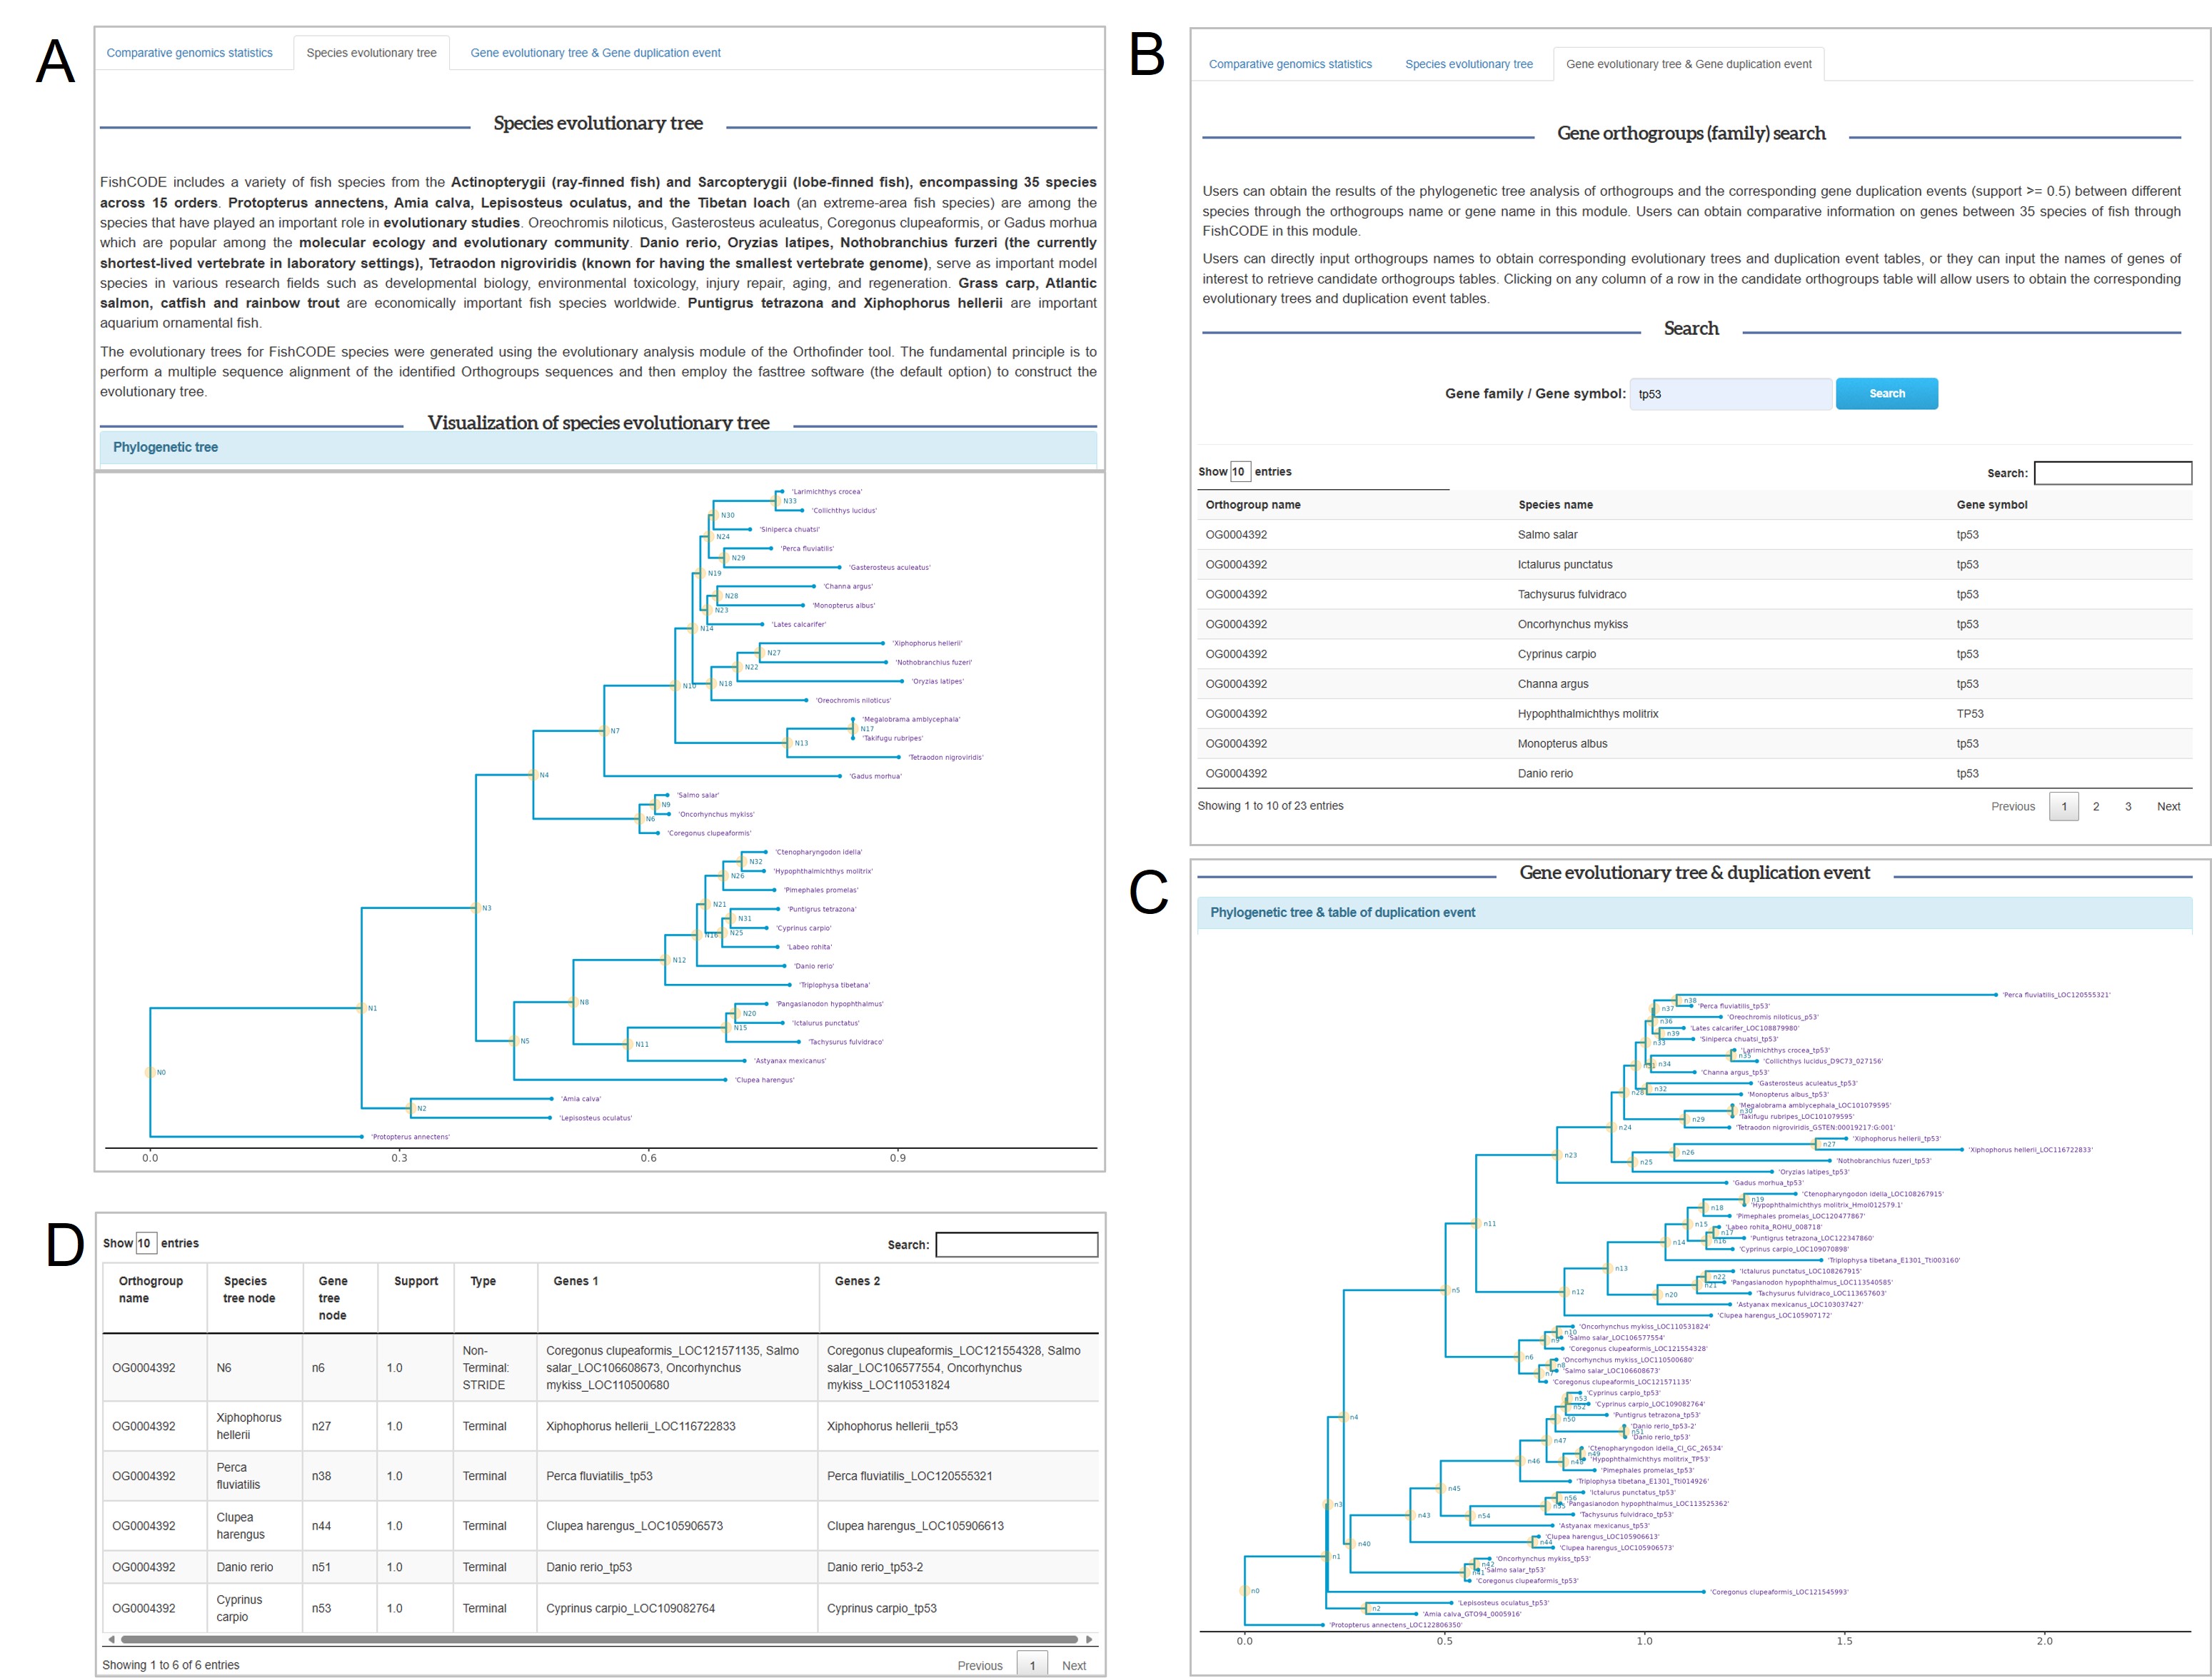
Comparative genomics browser: A. Species Developmental Evolutionary Tree. B. Gene Family Developmental Evolutionary Tree with Replication Event Query Module. C. Gene Family Developmental Evolutionary Tree Visualization Results. D. Online table of replication events within gene families (support > 0.5).
Case explanation: the user searches the gene of interest 'tp53' through the module of Fig. B, and obtains the corresponding gene family with developmental evolutionary relationship Fig. C. Taking the first row of replication events in Fig. D as an example, N6 represents the bifurcation point N6 of the developmental evolutionary tree of the species in Fig. A. N6 represents the bifurcation point n6 of the developmental evolutionary tree of the gene family in Fig. C, which It means that Coregonus clupeaformis_LOC121571135, Salmo salar_LOC106608673, Oncorhynchus mykiss_LOC110500680 had a replication event.
Build-in datasets selectors & User's own datasets & Design experiment
These parts are almost the same as "Transcriptome analysis". The difference is that in the "Methylation Analysis" part, users need to upload the methylation rate files of the samples one by one, and the prefix of the file name must be consistent with the name of the sample uploaded in the "Group File" It is worth noting that the files uploaded by users should not be larger than 5GB and the sample size of a task cannot exceed 15 samples
Remove batch effects
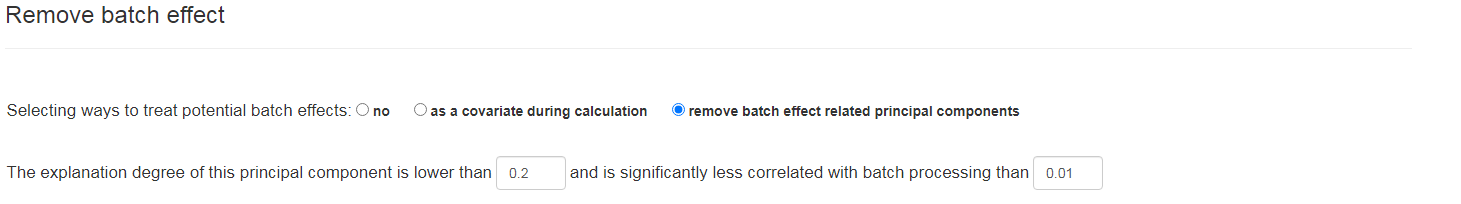
Remove batch effects: choosing 'no' will not perform batch effect detection. Choosing 'as a covariate during calculation' will calculate the batch effect as a metaKit covariate. Choosing 'remove' will calculate the significance of the batch effect and the principal components, and will delete the principal components with the user specified proportion and p-value. Of course, if no significant batch effect principal components are found, we will execute the 'no' option. This part has been integrated into the "Analyze data" section, and users can go to this section to set it up.
Analyze data
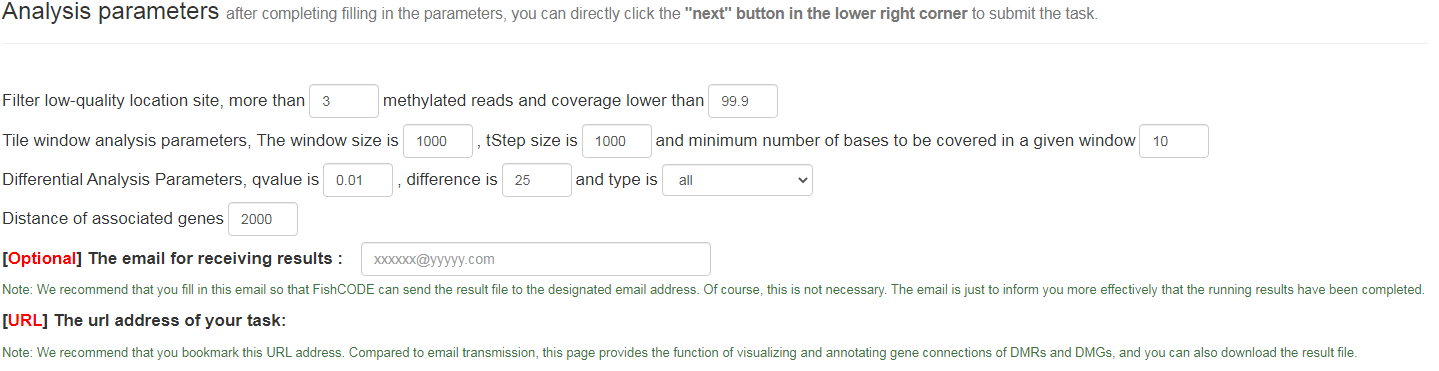
Analyze data: parameters include sample quality control, differential analysis parameters, email address for receiving results, etc. All parameters are default parameters. In fact, as described in the picture, the email address is also optional and is only used for result file transfer and notification. We will give a unique URL to the task submitted by the user. This page includes the running status of the task and the download of the final result. , DMR visualization, and linkage of associated genes with the FishCODE database.
Methylation results: background records
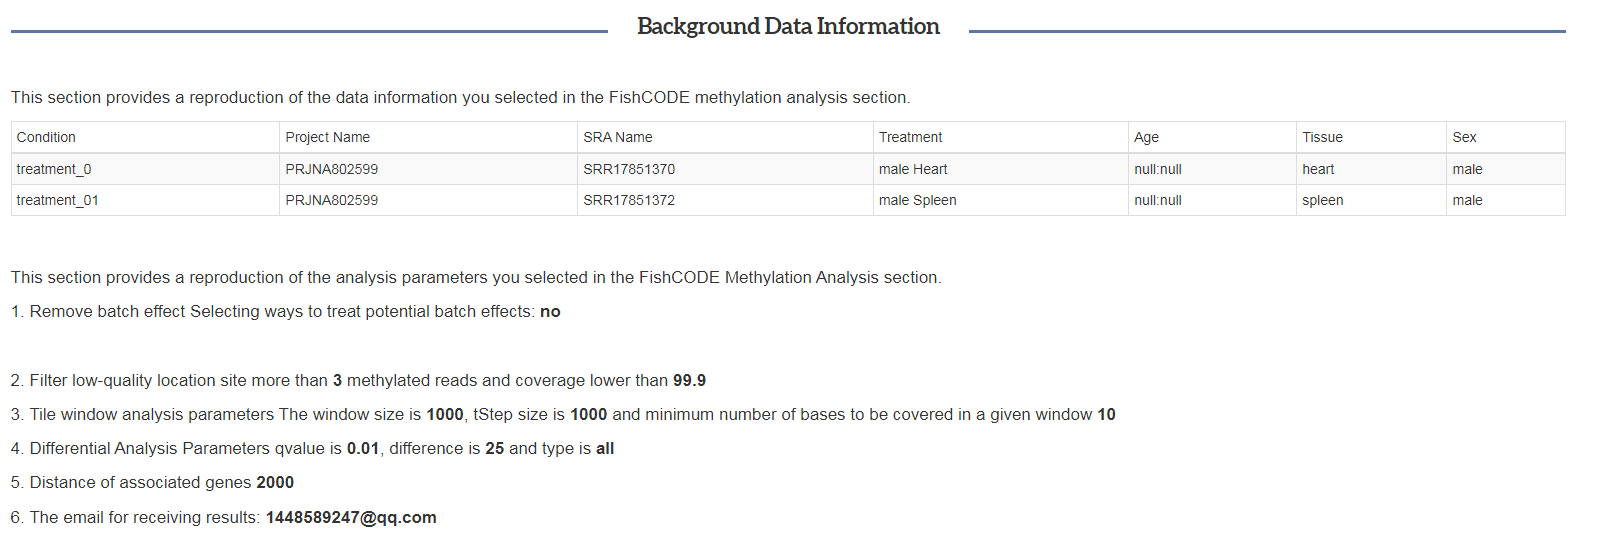
Background records: the first part of our results page strictly records the sample information selected by the user and the running parameter information.
Methylation results: running results and visualization

Running results and visualization: a: The status of the methylation task you submitted. The process of the status is as shown in the figure. b: The table of DMRs of the running result file, including the detailed location of DMRs, meth difference, annotated genes and other information. It is worth noting that clicking on different columns of each DMR (i.e. each row) will have different effects. As shown in the figure, the DMRs will be visualized respectively or jump to the FishCODE page of the corresponding gene. c: Visualization of DMR (displayed in JBrowse2's gff format), including genome sequence, gene structure, and three visualization tracks of DMR. Users can view the specific regions of DMR and the upstream and downstream positions of the corresponding chromosomes (can be dragged left or right or zoomed in) ), right-click DMR to view result information such as meth difference. example url
Methylation results: email

email content: the information you need for your FishCODE methylation analysis results can be found in 6 files in the attached zip package. background.txt: Sample information of your choice. parameters.txt: Analysis parameters of your choice. running_log.txt: running process report file. result_1.txt: DMR file. *.meth.gene.CG.txt: Gene information directly related to DMR. *meth.*.CG.txt: DMR specifies distance-related genetic information.